
Hello! We are Anne Vo (Associate Director of Evaluation) and Jacob Schreiber (Evaluation Assistant) from the Keck School of Medicine of USC. Anne oversees the Keck Evaluation, Institutional Research, and Assessment (KEIRA) Office and Jacob supports survey data collection efforts at the school.
We survey hundreds of students every week about their curricular experiences as an internal evaluation unit. Like many evaluation teams, we struggle with many moving parts, competing interests in outcomes and processes, and questions about efficiency and cost.
Our team is starting to better understand how individual behavior contributed to or inhibited our ability to collect data from students. These contextual factors are important because they influence the evaluation process, outcome, quality, and the ultimate use of evaluation. We conducted an evaluation process study to begin wrapping our minds around these factors and share what we have learned.
To chart our process—from survey generation to disbursement—we utilized Smartsheet, a project management tool originally designed to assist groups and teams prospectively keep projects on task.
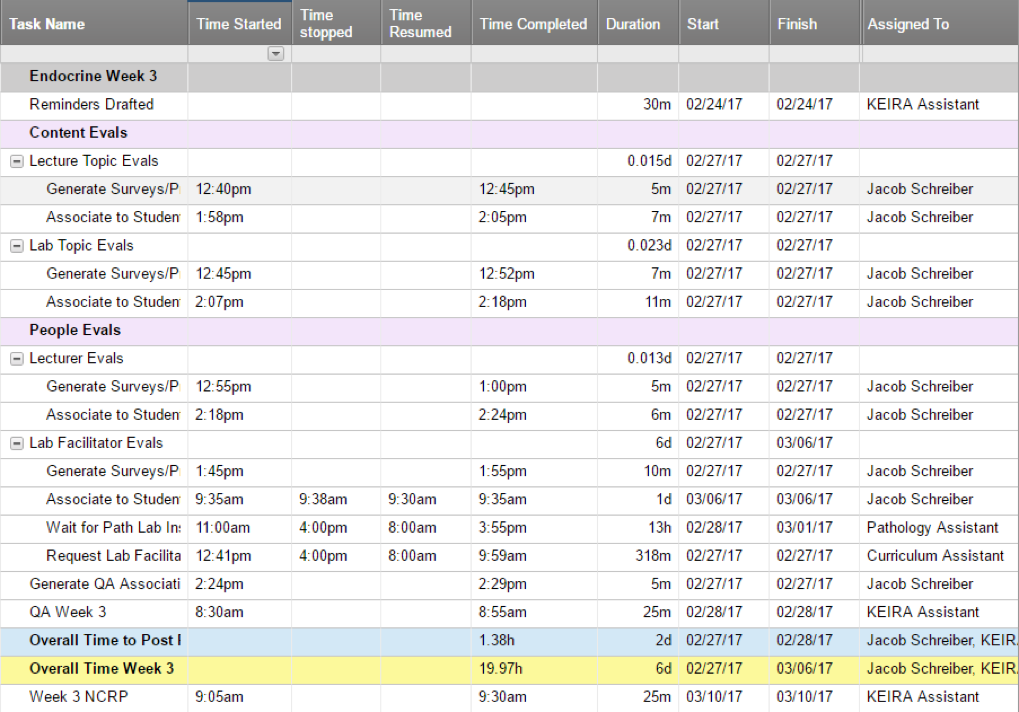
Because Smartsheet offers excellent visualization of workflow, instead of filling spreadsheets with projected dates and deadlines, we recorded the actual time it took to complete tasks. We did this by inputting the time we started and completed a task into the spreadsheet. We also kept track of how long it took other departments to respond to our requests for information, such as lists of instructors needed to create and post surveys.
Lessons Learned:
- Smartsheet offers the ability to record and view information about projects and processes in multiple ways. For example, the calendar view indicates various projects that need to be completed, tasks that can be subsumed under each, and the time required to finish them.
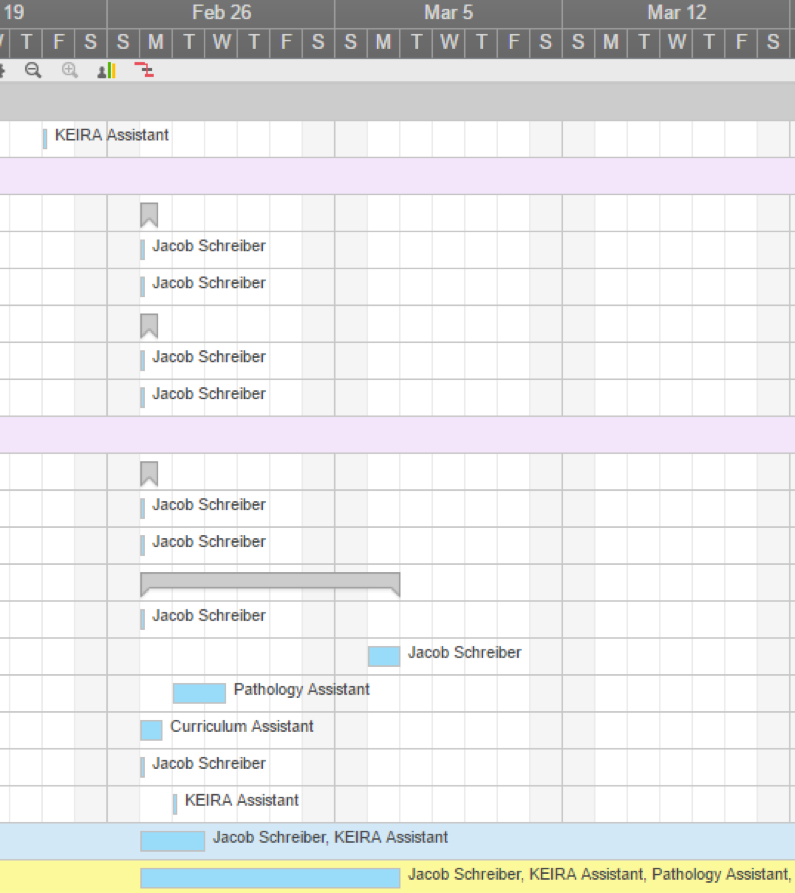
- Alternatively, Gantt views illustrate when these tasks took place over the course of a week as well as who is involved in their completion. This is a useful tool for demonstrating the flow of a process.
- Smartsheet captures data about time by day and week. As such, granular calculations (i.e., by minutes), may not be one of the tool’s strong suits. Still, Smartsheet allows users to export raw data as CSV files so these calculations can be done in other programs (e.g., Excel) or manually.
- Charting our survey process in this manner allowed us to pinpoint areas of suboptimal performance. The most compelling finding was that we spent 67% of our time waiting for important information from people in other departments. This helped us alter our own workflows for efficiency.
- Smartsheet provides a unique means by which process data can be collected and analyzed; however, we have yet to explore if it can be used to capture information about other factors that contribute to an enterprise’s effectiveness—context, input, and outcome. We hope this post inspires this line of inquiry within the evaluation community.
Rad Resource:
Learn more about Smartsheet here.
Do you have questions, concerns, kudos, or content to extend this aea365 contribution? Please add them in the comments section for this post on the aea365 webpage so that we may enrich our community of practice. Would you like to submit an aea365 Tip? Please send a note of interest to aea365@eval.org . aea365 is sponsored by the American Evaluation Association and provides a Tip-a-Day by and for evaluators.