
Hi, I’m Sara Vaca, independent consultant (www.SaraVaca.com), AEA365 Outreach Coordinator and Creative Advisor, and contributor to Saturday’s posts. As a former program manager, evaluator and meta-evaluator, I have come across maaaany reports. And probably many less that you.
Lesson Learned: Reports (inception reports, evaluation reports, program reports, you-name-it-reports) seem to continue to be one of the most common ways, almost like the unit we package information and knowledge to be shared. And even though there are alternative supports for it, it will probably be years (decades?) until we move on from them.
Hot Tip: Since we continue producing reports for others to read, let’s strive to make them look more appealing than the average we are used to read. Including Data Visualization elements to complement and illuminate the text, and/or eventually using graphic design services to improve its looks can help us spice them up. But there are other underexplored alternatives.
Cool Trick: Instead of opening a blank Word document to create your report, open a Powerpoint file to write it. What?! Yes, a Powerpoint document can be equally converted to a pdf, after which it will become a report, regardless of the program it was created in. A Powerpoint file, either in portrait or landscape orientation, can be a much better friend to facilitate your product looking much more innovative.
Here are a couple of examples of reports I have done recently, exploring Powerpoint possibilities:
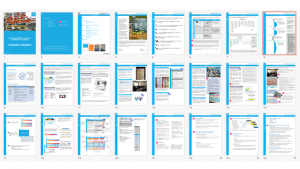
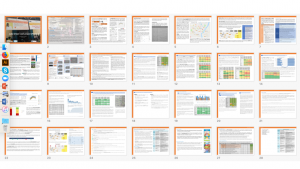
Lessons learned: Powerpoint offers different dynamic than Word, and these are the advantages (and disadvantages) I have observed comparing it to Word when creating a document:
- Advantages: Powerpoint allows me to think much more openly about the layout of the report. It is much easier to do different-width columns lay outs and alternating paragraphs and visuals in a very dynamic way. Besides, it allows you to customize each page in its all particular manner. I also find it makes you craft your sections in a more concise style, as you feel somehow limited in space (though in reality you can use as much space as in Word if you wish). Finally, the use of visuals, icons and tables is way less painful than in Word.
- Disadvantages: But not all is good. I have also realized some negative aspects. First one is that treating the text (for proofreading, translation, etc.) is more manual, and therefore slower. At the same time, each page acts at some point as a self-contented unit, where changes in one have to be manually corrected in the subsequent pages (it does not move automatically to the next page). In another order of differences, I have also remarked that in some rare occasions, this approach may be too innovative and may not always be a good idea (the rest of the time, it’s safe, encouraged and even begged!)
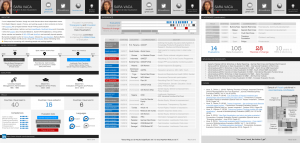
Finally, I also use Powerpoint for other purposes, for example, I am doing the last versions of my visual CV in it.
Do you have questions, concerns, kudos, or content to extend this aea365 contribution? Please add them in the comments section for this post on the aea365 webpage so that we may enrich our community of practice. Would you like to submit an aea365 Tip? Please send a note of interest to aea365@eval.org. aea365 is sponsored by the American Evaluation Association and provides a Tip-a-Day by and for evaluators.
Thanks Sara , it’s very inspirational!!
Thank you for sharing your ideas with the community. I also use PP/Google slides to track notes for regularly occurring meetings.
Hi Sara, Thanks for your timely post. I’m about to “spruce up” a report with some graphs instead of presenting training evaluation questions and results in tables of frequencies (ho-hum), and now I’m going to consider sharing the results in PPT! (I prefer downloading data from Survey Monkey into ppt so why not try it in this situation?)
I’d love to see the examples of your reports in the post. Is there a link?
Thanks.
Love it! Thank you Sara. Also, thank you for the pros and the CONS. Nice work. T