
Hello everyone! We are Miriam Jacobson and Natashia Bibriescas with the Expanding Pathways in Computing (EPIC) STEM Evaluation Services team at The University of Texas at Austin.
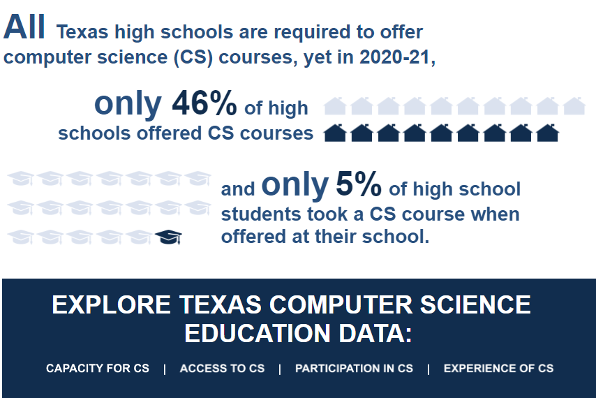
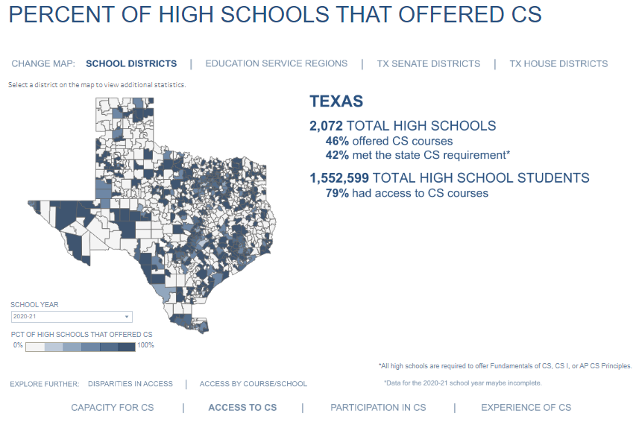
As university-based evaluators, we work with researchers and educators to study computer science (CS) education through evaluation, research, and data analytics. This year we were part of a team that developed a dashboard that provides data on CS education equity in Texas high schools, such as trends in CS teacher certifications, CS course access, and CS course enrollment. While our team previously shared these data publicly in static reports, the dashboard makes the data more accessible and allows users to answer their own questions to inform their work.
Hot Tips:
- Collaborate with others who work at the research, practice and policy level. Our team includes not only those who conduct research and evaluation, but also those at our university that have worked in CS education practice and policy as teachers, professional development providers, and leaders. By bringing their perspective of how data might be interpreted and used by educators and policymakers, they have guided us on what types of data and visuals would be most informative.
- Get input through meetings and user testing with different types of users. Our collaborators have incorporated the dashboard into presentations with teachers, administrators, and policy makers. In turn, they have shared feedback from these experiences to help us identify how to make the data more relevant and easier to navigate and understand.
- Prioritize dashboard development tasks. When gathering feedback, we quickly saw that we had more ideas than we could feasibly implement. We developed a spreadsheet of tasks that we continued to update that outlined each suggestion, its priority level, any challenges for implementing it, and the team member assigned to implement it. This approach has allowed us to continue to collect feedback, while keeping the scope of development to a manageable level.
Lessons Learned:
- Planning the dashboard prior to building it is imperative. In trying to meet the needs of different audiences we found the dashboard could easily become cumbersome, hard to navigate, and slow. Using an online collaborative software like Miro allowed us to map out the dashboard design in real time as our team worked on it. This type of tool also helped to facilitate discussions on the dashboard design with collaborators and allowed us to stay flexible to implement potential design changes and future updates.
- Input from educators can help address data limitations. As with most secondary data, we encountered challenges with missing data, data inconsistencies, and delays in receiving data updates. Having context from educators has helped us figure out how to deal with these issues when deciding how to analyze and present the data accurately, particularly when considering how the COVID-19 pandemic may have affected the educational data trends.
- Focus on the story you want to tell. By organizing the dashboard with a research-based framework for studying equity in CS education, we were able to highlight different types of equity for the dashboard user. The framework also helped us figure out how to build out the flow of the dashboard and hone in on what message each visual should deliver.
The American Evaluation Association is hosting University–Based Centers (UBC) TIG week. All posts this week are contributed by members of the UBC Topical Interest Group. Do you have questions, concerns, kudos, or content to extend this AEA365 contribution? Please add them in the comments section for this post on the AEA365 webpage so that we may enrich our community of practice. Would you like to submit an AEA365 Tip? Please send a note of interest to AEA365@eval.org. AEA365 is sponsored by the American Evaluation Association and provides a Tip-a-Day by and for evaluators. The views and opinions expressed on the AEA365 blog are solely those of the original authors and other contributors. These views and opinions do not necessarily represent those of the American Evaluation Association, and/or any/all contributors to this site.