
This is Sharon O’Connor with the Center for Program Design & Evaluation (CPDE) at Dartmouth College. I don’t know about you, but I send out A LOT of online surveys. I used to hit the send button and then grumble and mumble when responses did not instantaneously come flooding in.
When your response rates don’t meet expectations, what do you do?
In my case, as an internal evaluator of a STEM undergraduate research and workforce pipeline program in New Hampshire, seeing survey participation drop year after year, I got to thinking, “What’s wrong with kids these days?” And then I realized, it should be “what’s wrong with how I try to reach kids these days?”
In order to show program impact, we need answers from participants. In this case, I send out an annual follow-up survey (the “What’s up? Survey”) to participants who are 21-27 years old (recent college graduates or post-college by up to 5 years). These are “the first generation of true digital natives” – check out McKinsey & Company’s article ‘True Gen’: Generation Z and its implications for companies.
Hot Tip:
I realized I can’t invite younger adults to a survey the way I invite other (and older) participants. One-size-fits-all does not work here! If this resonates with you, I invite you to adapt your survey administration strategy – no matter what survey platform you use.
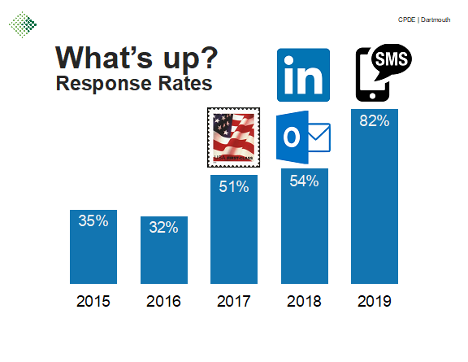
Starting in 2017 I added mail campaigns to my email messages. The US postal service is alive and well. Sending a paper survey home to the parents was successful at bumping up the response rate.
In 2018, in addition to using the Qualtrics email distribution system, I added Outlook email merge to ensure my invitation was reaching inboxes (because we know that messages from Qualtrics can end up in spam folders, depending on the receiving institution’s firewall). When email communication fails, we trolled online for relevant information. LinkedIn is a great resource (assuming these students have accounts) for finding out what kind of job they have or if they’re in graduate school.
In 2019 the real magic came when I added SMS text messaging – this is a Qualtrics add-on feature that allows you to text the survey link to cell numbers. I hit the send button last year for the first time and (quite literally) watched as responses came pouring in.
Since 2017 I have also made in-person appeals at the annual summer research conference. During my presentation I directly address the undergraduate students in the audience, telling them WHY we need to connect with them after they graduate. “When you respond to the surveys I send you, you provide information to help the program improve, and to help ensure the program continues for other students coming up behind you” is more or less what I say.
Lessons Learned
These strategies work – survey response rates went from 35% in 2015 to 82% in 2019.
The American Evaluation Association is celebrating STEM Education and Training TIG Week with our colleagues in the Science, Technology, Engineering, and Mathematics Education and Training Topical Interest Group. The contributions all this week to aea365 come from our STEM Education and Training TIG members. Do you have questions, concerns, kudos, or content to extend this aea365 contribution? Please add them in the comments section for this post on the aea365 webpage so that we may enrich our community of practice. Would you like to submit an aea365 Tip? Please send a note of interest to aea365@eval.org. aea365 is sponsored by the American Evaluation Association and provides a Tip-a-Day by and for evaluators.