
I’m Ryan Watkins and I teach needs assessment at George Washington University and for The Evaluator’s Institute. Last year in AEA365, I introduced formulas for how we can determine the necessity and/or sufficiency of a desired result leading to other desired results – thus offering tools for quantifying needs (i.e., gaps in results). This year I’m offering an example to help make the concepts a little more concrete.
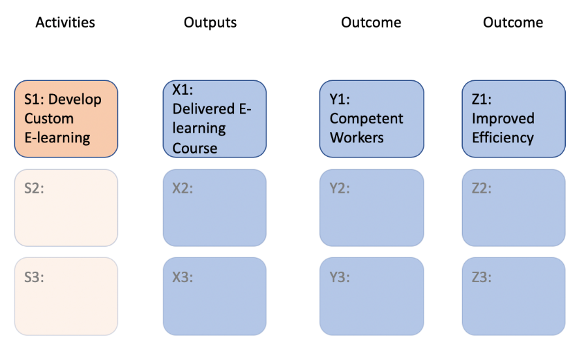
Let’s start with a new education program example and its Theory of Change (TOC). From the TOC we see that a desired output is a delivered e-learning course (X1), and a desired outcome is 100 participants will competent in the skills area after one year of delivery (Y1) and that the organization will see improved efficiency through the application of those skills (Z1). What we don’t know, however, is if in-house development a new e-learning course is a necessary and/or sufficient solution (S1) in order to achieve X1, Y1, and Z1, or what alternatives may be better.
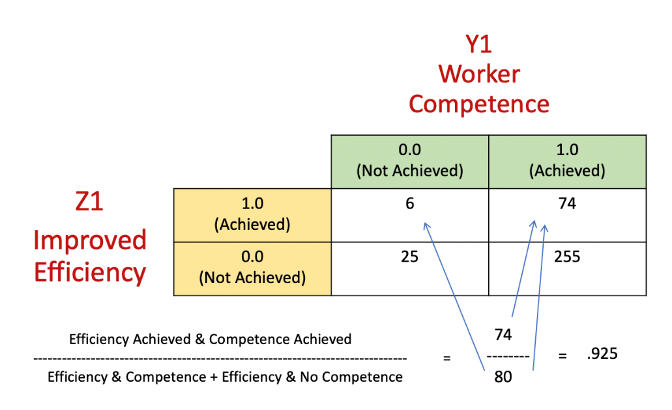
To begin our needs assessment, we want to focus just on the relationships among results. For example, is Y1 necessary and/or sufficient to achieve Z1? The extent to which we can find evidence for these relationships defines the needs of the program. If we find that you can routinely accomplish Z1 without first achieving Y1 (that is, the organization has improved efficiency without increased worker competence), then we can reconsider if Y1 is a need or a want.
Data can be limited, but to the extent that it is available, we examine the necessity relationships by looking at similar programs. For simplicity, I am using binary data (achieved/not achieved) whereas the formulas from last year’s post were for fuzzy data (levels of achievement), though if you understand one the other can be derived (as illustrated in this article by Charles Ragin).
Similarly, we can examine the sufficiency relationships to determine if Y1 is sufficient to accomplish Z1.
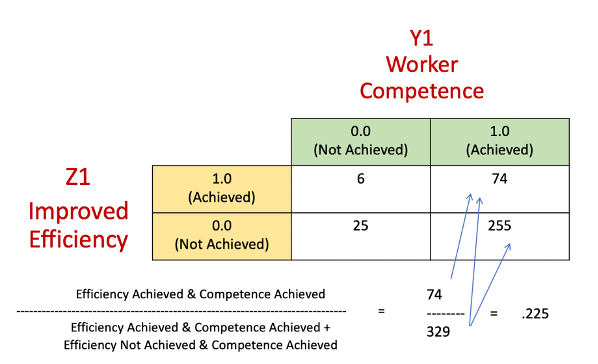
In this case, you can see that the result Y1 (increased work competence) is necessary in many instances (i.e., 93% of the time) to achieve the desired result of Z1 (improved efficiency), though it was rarely sufficient (i.e., 23% of the time) and would have to be integrated into a system of solutions to fully accomplish Z1. Then, when we know what results we are going to accomplish and why, we can turn our attention to ‘how’ — the proposed solution for achieving X1, in this case the in-house development of an e-learning course. As with any solution, we always (yes, always) have alternatives to consider and we can use the same process to determine the necessity and sufficiency of each alternative, as well as varied combinations.
By using data to examine necessity and sufficiency relationships across the Theory of Change, our needs assessment can reflect on what is really required in order to achieve the results we want to achieve.
The American Evaluation Association is celebrating Needs Assessment (NA) TIG Week with our colleagues in the Needs Assessment Topical Interest Group. The contributions all this week to aea365 come from our NA TIG members. Do you have questions, concerns, kudos, or content to extend this aea365 contribution? Please add them in the comments section for this post on the aea365 webpage so that we may enrich our community of practice. Would you like to submit an aea365 Tip? Please send a note of interest to aea365@eval.org. aea365 is sponsored by the American Evaluation Association and provides a Tip-a-Day by and for evaluators.
Hi Ryan,
This very interesting- I am intrigued by your example. I can imagine where my evaluation partners particularly those with an affinity for quantifying data would gravitate to this method. I can see myself who largely gravitates toward Mixed Methods and Qualitative evaluation methods infusing some measures such as these to attract folks on both sides of the needs assessment table.
Thank you again for your contribution! I look forward to infusing your method into my next needs assessment evaluation.
Cheers,
Sondra
Sondra LoRe, Ph.D.
Manager | National Institute for STEM Evaluation and Research (NISER)
Adjunct Professor | Evaluation, Statistics, and Measurement Program, Department of Educational Psychology & Counseling
slore@utk.edu