
Hi, my name is Elizabeth DiLuzio, and I’m the Manager of Evaluation and Strategy at Good Shepherd Services in New York City. Today, I want to talk about race.
As evaluators, we are united by a commitment to social justice. Yet when is the last time you stopped to consider what it means when race – a common descriptive demographic for our participants – is also a historical driver of inequity?
Since the birth of this country, citizens have been assigned to socially constructed race categories. Data on these categories are then used to justify systems that inequitably allocate resources and unfairly treat targeted groups. As such, it is easy for today’s evaluator to use data on race to unintentionally uphold these unwilling groupings and inequitable systems.
Yet there are people that feel strongly connected to their racial identity. And the intentional analysis of race data can be a powerful tool in illuminating the many facets of structural racism. When done strategically, these types of analyses help to intervene and track progress towards goals of equitability. So the question arises: how do evaluators ensure race data are used to promote diversity, equity, and inclusion?
The first step is acknowledging the complexity of race. Engage in conversations and learning opportunities about this complex topic. Gauge where staff is at and where they still need to go. Then, take an honest look at race’s data lifecycle within your organization. In order to do this, there needs to be an honest and ongoing inquiry into how data on race is used to empower participants at every stage. When discrepancies are uncovered between an organization’s use of race data and its mission, evaluators can help to facilitate the learning and strategic planning needed to make the necessary organizational changes.
Sample questions for reflection at each stage of the data lifecycle include:
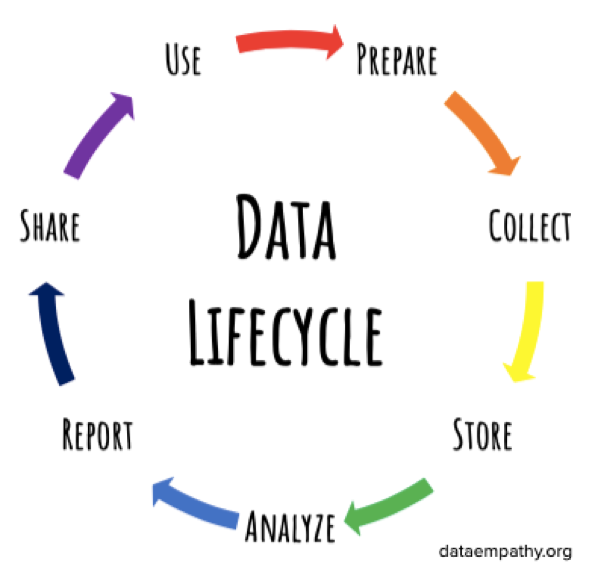
- Prepare – Which categories align with how our participants see themselves? Which are unhelpful/unclear?
Rad Resource:
The County of San Francisco’s Department of Public Health has spent years blazing this trail through thoughtful workgroups, extensive research, and an inclusive vetting process. Check out their Ethnicity Guidelines that document the why’s and how’s of their work.
- Collect – How much do we share with participants why we collect their data? Do they feel comfortable opting not to disclose?
- Store – Who has access to the data? How secure is it?
- Analyze – In which analyses do we incorporate race? How? To what end?
- Report – How are we reporting on race? What are we communicating?
Rad Resource:
Instead of simply reporting the agency’s demographic information, Children’s Institute in Los Angeles took the opportunity for advocacy in their 2017-2018 Impact Report by providing the demographics for LA County as a point of comparison.
- Share – Who has access to the reports? Why?
- Use – How are our analyses and reports impacting future programming? Where can we go from here?
Rad Resource:
Interested to learn more? I have a book titled the Data Empathy Project coming out in 2020!
The American Evaluation Association is celebrating Latina/o Responsive Evaluation Discourse TIG Week. The contributions all this week to aea365 come from LA RED Topical Interest Group members. Do you have questions, concerns, kudos, or content to extend this aea365 contribution? Please add them in the comments section for this post on the aea365 webpage so that we may enrich our community of practice. Would you like to submit an aea365 Tip? Please send a note of interest to aea365@eval.org. aea365 is sponsored by the American Evaluation Association and provides a Tip-a-Day by and for evaluators.