
My name is Pankaj Verma and I work as an Evaluation Officer in IED.
Yesterday’s post was about how we scope our evaluations in IED. Today is all about our methods. In the past, methodology usually fell under two broad approaches: qualitative and quantitative. A third approach, mixed-methods, is often used by researchers and evaluators as a practical one. Almost all evaluations done at IED employ a mixed-method approach, providing three distinct advantages.
- We can use many sources of information: documents, daily reports, annual reports, interviews, focused group discussions, surveys and direct observation.
- It allows for opportunistic quantification wherever possible (see below)
- It allows for triangulation to a greater precision.
My personal favorite is opportunistic quantification, which is particularly important in the context of evaluating UN entities, particularly peacekeeping operations. The issue is not a dearth of data but an abundance of it, and it’s often in a format that requires a tremendous amount of cleaning. Before I explain that, the first question I ask is “does this document have information that I want to extract”. If the answer is yes, then “what are the tools available to extract the information”, and finally, “is it worth the time and effort?”. This comes in handy if, suppose, I have about 1000 daily reports from an entity and I want to extract the date, location, and type of activities to conduct an analysis of their work in a country.
I would use python to extract information from the daily reports and STATA to clean the data for further analysis. Then I would use QGIS, an open-source software, to superimpose them on the map of the country to conduct a grid analysis, described in more detail in Phayal and Prins’ 2018 report.
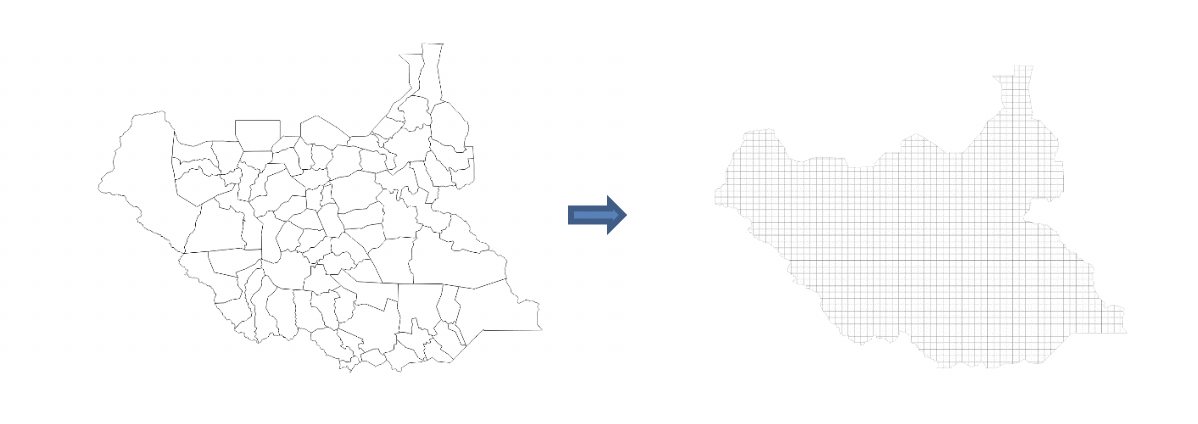
With grid analysis, I can construct a grid of certain size, say 20 km, which will then become the unit of analysis. Once I have the grids, I can superimpose the table as a layer that I had extracted from the daily reports.
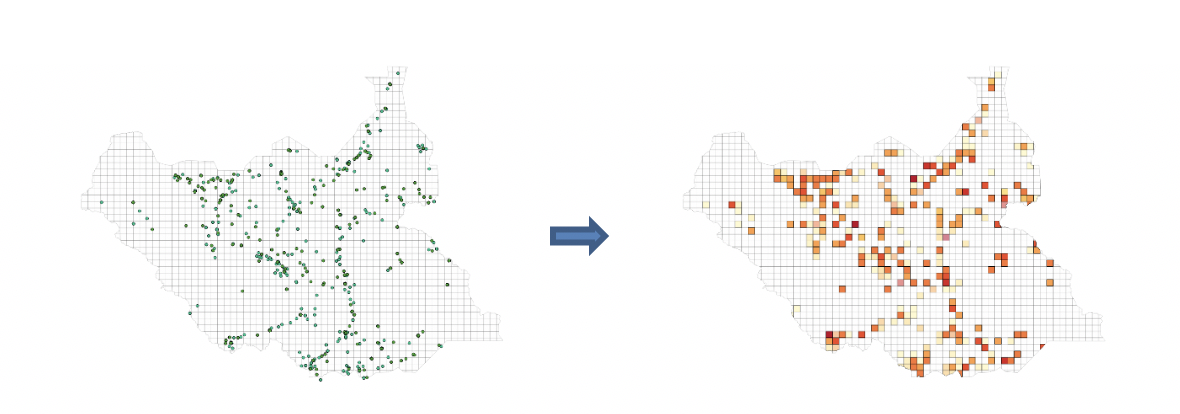
Once all available information is assigned to their respective geographical grid, it makes it possible to conduct analysis that I couldn’t have managed to do earlier.
Lessons Learned: Evaluators can unleash the full potential of data. This helps in achieving more precision in triangulation and serves towards building a culture of data harvesting and evidence-based decision making.
The American Evaluation Association is celebrating Inspection and Evaluation Division (IED) of the UN’s Office of Internal Oversight Services. All posts this week are contributed by evaluators who work in IED. Do you have questions, concerns, kudos, or content to extend this aea365 contribution? Please add them in the comments section for this post on the aea365 webpage so that we may enrich our community of practice. Would you like to submit an aea365 Tip? Please send a note of interest to aea365@eval.org . aea365 is sponsored by the American Evaluation Association and provides a Tip-a-Day by and for evaluators.