
Hello, I’m Elise Garvey, a senior management auditor from the King County Auditor’s Office in Seattle, Washington. I have become a huge fan of using data placemat sessions for my projects ever since learning about them at Eval 2015 and learning more from Kylie Hutchinson’s tips and tricks. Data placemats are large sheets of paper with themed snippets of raw or basic data analysis, and a data placemat session is when you review and discuss those placemats with stakeholders. This has been a really valuable tool for ensuring I’m understanding the data I’m using and getting the perspective of people closest to the data.
On a recent project, I decided to hold multiple data placemat sessions using the same data, but at different stages of the project and with different stakeholders within the organization. Here are some hot tips and rad resources for doing the same for your projects:
Hot Tips:
- Consider doing data placemat sessions at multiple levels, especially if you are working with a large organization where not everyone talks to each other frequently. Holding multiple sessions can help to use this tool for different purposes. For example, our first session was with the program staff who knew the program and the data well, so we really wanted to take advantage of the opportunity to see if our data cleaning and basic analysis made sense and to learn about their reflections on the data. The second session was with agency leadership, so we were better able to understand what this data meant to them as leaders thinking about the context of the whole organization.
- Adjust the placemats for your audience: For that first session with program staff, I kept the data and visualizations simple and a little more raw, like this:

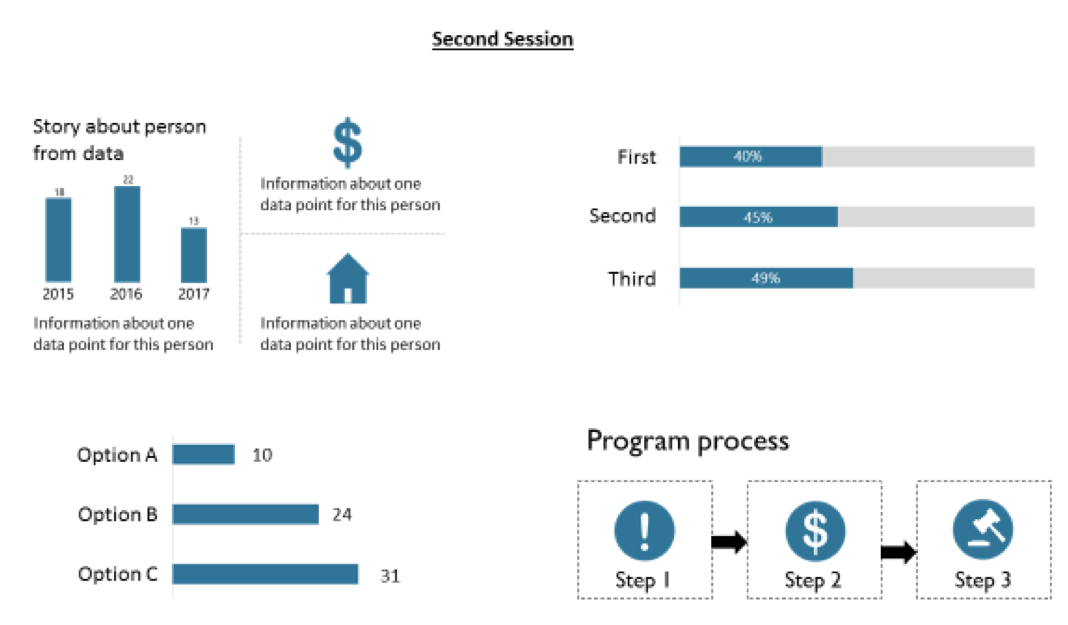
For the second session, which was with agency leadership, the placemats became a little more akin to dashboards, but still presented in a way to solicit feedback and generate discussion about what the data meant to them. So there are more visualizations and fewer tables or raw data, like this:
Rad Resources:
- I still rely on the 2016 NDE article by Veena Pankaj and Ann Emery on data placemats- it’s well-written guidance to help you get started!
- AEA 365! Use “placemat” as a search term and you can find a bunch of other posts on this tool with more great tips and resources!
The American Evaluation Association is celebrating Gov’t Eval TIG Week with our colleagues in the Government Evaluation Topical Interest Group. The contributions all this week to aea365 come from our Gov’t Eval TIG members. Do you have questions, concerns, kudos, or content to extend this aea365 contribution? Please add them in the comments section for this post on the aea365 webpage so that we may enrich our community of practice. Would you like to submit an aea365 Tip? Please send a note of interest to aea365@eval.org. aea365 is sponsored by the American Evaluation Association and provides a Tip-a-Day by and for evaluators.