
Hello! I’m Amanda Klein, owner of Structured Solutions Educational Consulting, LLC. I help schools, districts, and related organizations tell the story of their impact on children and families. My passion comes from years of working in urban schools with students and families. I never forget that every line in a spreadsheet represents a real child who is not only influenced by the school, but also by his or her family and community.
Many students will not return to school before this summer, so it’s more important than ever to understand what needs they may have. Using data to pinpoint which students are at the greatest risk of disengaging from (online) school or whose families struggle to meet basic needs is essential for targeting interventions and outreach.
As evaluators, we have the skills to help educators with this important work, and there are tons of public data and mapping tools to help us. I’ve used them in many ways – describing the community for grants or needs assessments, determining which students need home visits, or figuring out which resources are near students’ homes. The options are endless! Given the disproportionate impact of COVID-19 on disadvantaged communities, knowing what children and families need – and acting on it — is critical.
Rad Resources: Here are some national mapping and data tools to explore your community:
Demographics
- U.S. Census Bureau QuickFacts and Data Explorer
- Income Segregation Maps (Stanford Center on Poverty and Inequality)
- KIDS COUNT Data Center (Annie E. Casey Foundation)
Education
- School and Community Factors that Affect Learning (Brookings Institution)
- School Zones and Segregation (Vox)
- Education Data Explorer (Urban Institute)
- NAEP Report Cards – Data Tools
Health
- U.S. Department of Health and Human Services Datasets
- USDA Food Access Research Atlas
- Air Pollution Map (Center for Public Integrity)
- HRSA Mapping Tool
- COVID-19 Dashboard (Johns Hopkins University)
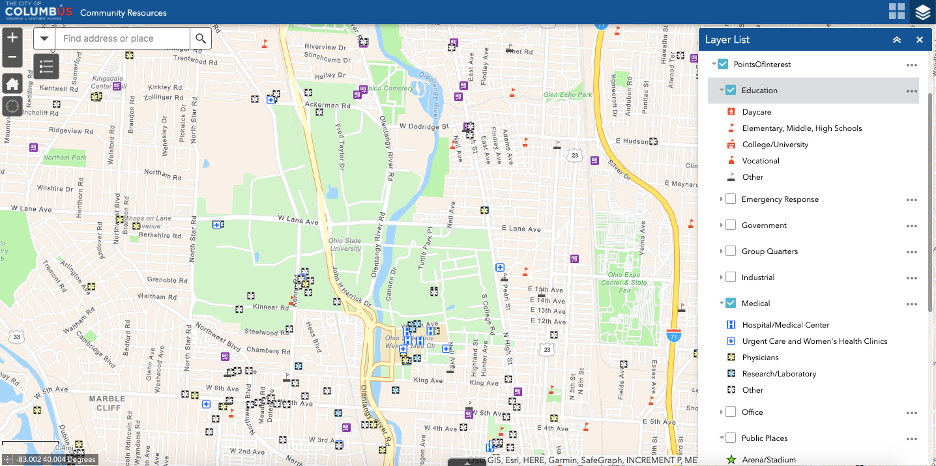
City and county agencies also have amazing resources. See if your health or police departments, school districts, or universities have online tools for exploring your area. Here’s a map I created of the schools, hospitals, and other services where I live, from the city’s mapping tools.
Hot Tips: Here are two other useful tips:
- Use what you learn from your mapping explorations to influence survey questions and interview protocols for students and families. For example, if there has been a recent rise in crime rates in a neighborhood, ask families and students if they feel safe and what the school or district could do to make them feel safer.
- For your own data, use Google Maps! You can map multiple data sources and use colors, symbols, and labels to make sense of your data.
The American Evaluation Association is celebrating Ed Eval TIG Week with our colleagues in the PreK-12 Educational Evaluation Topical Interest Group. The contributions all this week to aea365 come from our Ed Eval TIG members. Do you have questions, concerns, kudos, or content to extend this aea365 contribution? Please add them in the comments section for this post on the aea365 webpage so that we may enrich our community of practice. Would you like to submit an aea365 Tip? Please send a note of interest to aea365@eval.org. aea365 is sponsored by the American Evaluation Association and provides a Tip-a-Day by and for evaluators.
Hello Amanda,
Your post got me thinking about the community resources in the area I live in. Without too much digging I was able to find an entire gallery of interactive maps on the city’s website containing everything from current construction to flood zones. It’s interesting to see resources like this that are right under our noses but aren’t widely talked about.