
We’re John Nash, Chair, and Jenny Lyons, Co-Chair, from the Data Visualization and Reporting TIG. We have a great week planned!
We want to lay down some simple truth talk: communicating findings and data is not easy work. We probably don’t need to tell you the current landscape of reporting is not wonderful. There are still exploding pie charts and 100-page reports going out to the world. Our audiences deserve better.
Lesson Learned:
- Knowing your target audience is everything. Your audience drives everything from the mode of communication, visuals, and language used. Invest ample time and energy into identifying and getting to know their interests, needs, and burning questions.
- Keep utilization at the forefront of visualization and report development. Keep in mind that data visualizations and reports aren’t merely developed for their own sake. The ultimate purpose of a visualization or report is that it is used. People should use evaluations to foster impact and change.
Hi, I’m Kasey Gordon, M&E Specialist at the Ministry of Planning and Development in the warm isles of Trinidad and Tobago. I love nature and dream a lot but lose sleep worrying about how evaluators and researchers communicate findings. In a generation of tweets, 20 second page visits, 2-3 minute videos and 10 second vines and memes (see cool Infographic on attention span), it’s tough. We write papers and reports that lack generational appeal with little reach or impact online. When I hear “too long”, “boring”, “not engaging” and ultimately dreaded, “…AND!”, I’m led to believe that even if we speak truth to power, audiences still may not care. I’m guilty also because if it doesn’t tell me an entertaining story I will ‘frown-upon and scroll-down-upon’ it. We want audiences to notice, read, value, use and possibly share… right? So the pertinent questions are, How do we get them to care? and How do we captivate and reach them?
Storytelling and Content Marketing can help. Storytelling, particularly accompanied by visuals, is a needed art that keeps attention while sharing important findings. It’s more difficult than presenting sterile data alone. Dr. Brene Brown would say “Stories are just data with a soul.” Check this diagram I did about ‘souling-up’ reports and findings.
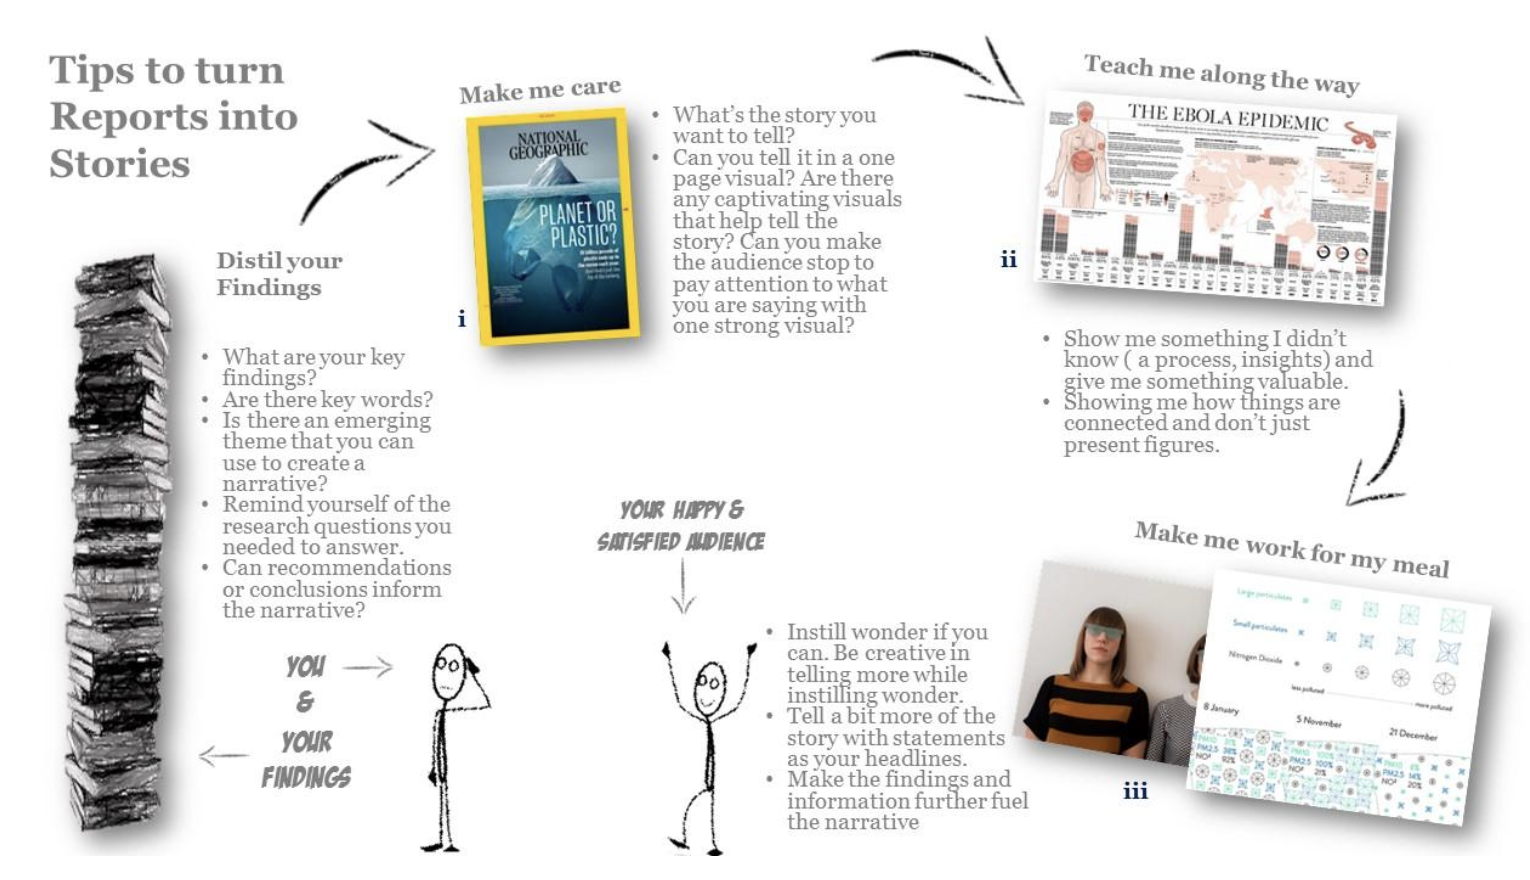
i – An amazing Nat Geo campaign image that made me stop, stare and care
ii – An epic infographic from National Post explaining Ebola facts.
iii –Intriguing wearable data designs by Stefanie Posavec supporting the “Air transformed” story.
Hot Tip: Try developing 1-page summaries, infographics and supportive images to dispense information in multiple formats for a diverse audience. This helps whittle large reports into more shareable items.
Versta Research summed it up saying “far from telling lies, most reports fail to tell any story at all.” Stories should never take away the truth of findings, and even a good story can still be silently buried in the sheer volume of content uploaded, shared and posted. This is where Content marketing helps in reaching audiences. What I’ve learnt from Animal Político’s news reports on The Master Fraud is that knowing your audience and their channels is as important as storytelling through information design, formats and multimedia.
Your audience is never obligated to give attention no matter how scientific or factual findings are. Storytelling and Marketing help achieve this and are key in the march of truth to power. Perhaps even climate change awareness could have had more of an impact if more of these tools were applied, who knows?
Rad Resources:
- “Game of Knowns” – brief intro to Content Marketing
- Stephanie Evergreen – making reports visually digestible
- Aruffo’ s paper – turning scientific findings into stories
- Infogram – easy infographics
The American Evaluation Association is celebrating Data Visualization and Reporting (DVR) Week with our colleagues in the DVR Topical Interest Group. The contributions all this week to aea365 come from DVR TIG members. Do you have questions, concerns, kudos, or content to extend this aea365 contribution? Please add them in the comments section for this post on the aea365 webpage so that we may enrich our community of practice. Would you like to submit an aea365 Tip? Please send a note of interest to aea365@eval.org. aea365 is sponsored by the American Evaluation Association and provides a Tip-a-Day by and for evaluators.
Hi,
Thank you so much for your thought-provoking post on how to turn reports into stories. The ideas in your post speak to many issues that I grapple with daily in my work with students, as well as themes I am exploring through a course on Program Inquiry and Evaluation. Since I often struggle to overcome the challenges of creating reports that support utilization, I found your suggestion of using storytelling and infographics to be very insightful, exciting and timely. Visuals like infographics can be a powerful way to reach individuals in the fast-paced environment in which we live, where data overloads are common.
In my work in higher education, I have seen the use of storytelling, graphic recording and infographics grow rapidly over the last few years. They seem to have become great ways to easily communicate with diverse audiences in engaging ways. For example, many of the conferences I have attended over the last year had a graphic recorder summarizing the keynotes!
One of the most powerful experiences I had just this past year was seeing how enthusiastic my students were to create their own infographics in a first-year nonmajors science literacy course. They did an amazing job at conveying complex scientific information with imaginative and thoughtful infographics as part of this assignment. Many of them told me that they became inspired to make their own infographics for other courses to help reinforce and summarize information to improve their learning. This experience has in turn inspired me to think about how to integrate the use of infographics in the work I am currently performing in program evaluation.
Thank you for sharing your infographic on “souling-up” reports and findings. I think it provides those new to the design and creation of infographics some great food for thought as they begin adopting their use. You included some helpful and inspiring resources at the end of your post, and I was also wondering whether you had seen social media sites or forums where infographics were particularly shared or discussed. Related to my discipline, I recently found a Twitter feed on chemistry-related infographics that is very effective and was wondering if you knew of things like that which perhaps focused on using infographics for education or other challenging technical topics.
Thank you again for a great post!
Hi there,
I enjoyed reading your post about how to effectively communicate your findings as evaluators. With the general audience having shorter attention spans, finding techniques on how an audience can utilise information in a meaningful way can be challenging. When I think of evaluations and the data that come from it, my mind goes to 100 page reports and confusing pie charts, as described in your post. The resources that you referred to that helps to make information visually appealing is a great strategy. I wish lengthy research articles adopted the same practise, as it would give people more access to academic literature in a more “user friendly” way. Evaluations can take a lot of time, energy and resources and finding ways for an audience to better use the information will help with the longevity and credibility of the evaluation.
Thank you for sharing!?
Vitra
Hello,
Thank you for your thoughtful post. I am currently in a course learning about Program Inquiry and Evaluation, and I found that the message of your article really resonated with me in applying my learning to my workplace. I work at a large postsecondary institution, and my job includes daily interactions with undergraduate students. They are a generation who connect and communicate in different ways than I am used to- for example, we have noticed that Facebook is no longer a reliable way of getting student attention, and in fact email is more effective. The idea of communicating with this group, and trying to make them care, is always on my mind. We live in a fast-paced world, and the fact is that people do not always take the time to read lengthy articles. An infographic distills that information, but also allows the creator to be clear about the meaning they derived from the data!
I have found that other institutions in my region have adopted the idea of storytelling when it comes to data- I was at a student affairs conference recently and noticed that there were people whose position titles included the word ‘storyteller’. This is an interesting shift, as it highlights the importance of those working with data having skills in presenting it in an interesting, engaging way. Of course, it is important that the data and analysis remain as important as the creative ways we share them- without the behind-the-scenes work of evaluators, an infographic is just a picture.
I will take the lessons from this article into my work in student services. Thank you for this clear guide to turning reports into stories!
Thank you for sharing your kind words but more so the experience with your undergrads.
Trying to shape data into a story and make the audience care is magical ingredient and it isn’t easy work as John and Jenny say. Much of my inspiration that led me to see the value of “storytellers” and the art of storytelling in Evaluation came from an International Association of Facilitators (IAF) conference where Deborah Riegel had a chat with us about the ‘Power of stories for facilitators’. As passionate Evaluators we really want to see data with high utility value and some of us in the DVR group can attest to becoming multi-disciplinary with a creative frankenstein skillset. The creativity required can be intimidating for many who see themselves as “I’m just not able to do this fancy stuff”. I myself suffer from imposter syndrome at times. But I think that’s okay to feel intimidates at times once we remember we can also can rely on the pros. I remember Stephanie Evergreen saying that, as an alternative, after we have our findings we can just hire a good graphic artist (who is already sharp with skills of content marketing and the nuances of your audience).
Hello,
Thank you for you engaging post. I wanted to share my thoughts on your suggestions.
The post mentions that communication of data finding has not evolved from previous models of pie charts and lengthy reports. This is problematic as reading, application, analysis and reflection of outlined suggestions becomes problematic, simply due to difficulty with data interpretation and the time consuming process of understanding the entirety of the report. I completely agree with this assessment.
Thus, it is extremely important to understand the audience demographic and interests, as this can lay the foundation regarding the construct and presentation of the reporting. Utilization of the data and evaluation results is the key to successful implementation of suggestions, and as we know, this is also the main reason of conducting an evaluation itself.
A suggestion made in the post is to make evaluation reporting more engaging, valuable and relevant to the current audience is the use of Storytelling, accompanied with appropriate visuals; thus, amalgamating authentic data with engaging reporting structure allows for differentiation for a diverse audience, along with making sure that ‘sterile’ data alone does not disengage the audience.
I concur with the phrase, Truth to Power, is a formidable but necessary approach to build awareness of the evaluation, why the evaluation was necessary, and how to improve the program and user/team experience and applicability, so that progressive measures are implemented. Storytelling with supplemented visuals as the suggested ‘modus operandi’ is particularly attractive to me as an Educator, because I see first hand the power narrative with visuals has over students, colleagues and my own children. Storytelling inherently is part of our collective cognition, be it through culture or shared practices in an academic setting. Stories, whether factual or fiction, imbibe on our intrinsic need to learn, engage, reflect and suggest opinions of decisions characters make in various settings and times of adversities. It is a universal way that resonates with almost the entire audience, while also being an excellent way to use inclusive setting and practice to recognize the diversity an abilities of the participants.
I must admit to feeling that this is a simple and obvious solution to the problem of evaluation reporting and application, but one never really thinks about it in detail, unless one is involved in an evaluation, whether as an evaluator or the evaluated. It is important to care and value the work behind the evaluation process, so that improvements are not just visible in the reporting, but in actuality as well.
Best,
Marium.