
Greetings from Minneapolis, Minnesota! I am Angie Ficek, a Program Evaluator at Professional Data Analysts (PDA), an independent consulting firm specializing in evaluating public health programs. We wanted to share three data viz related features in Office 2016 that are easy and helpful for spiffing up evaluation reports and presentations.
Cool Tricks:
1. Icons: Icons are a fantastic way to communicate ideas without words, and there are some wonderful websites out there from which to download icons. But, did you know that Office 2016 has its own icons? Simply go to the Insert tab, and you will find the Icons option between Shapes and SmartArt.
The downside is that there are far fewer options than, say, Noun Project, but the great part is that you can easily change the color of the icon (to any color!). Just click on the icon, go to the Format tab, and select a color from the Graphics Fill menu. Hats off to you, Microsoft!

2. Maps: You may have noticed that Office 2016 has some new chart types, one of which is a Map chart. My colleague showed me just how easy it is to create a map with this feature. She had a column of county names and a column of numbers, and simply by clicking Insert > Map, a map of that state was produced and the data was mapped and scaled accordingly. See an example of a default map below with some sample data.
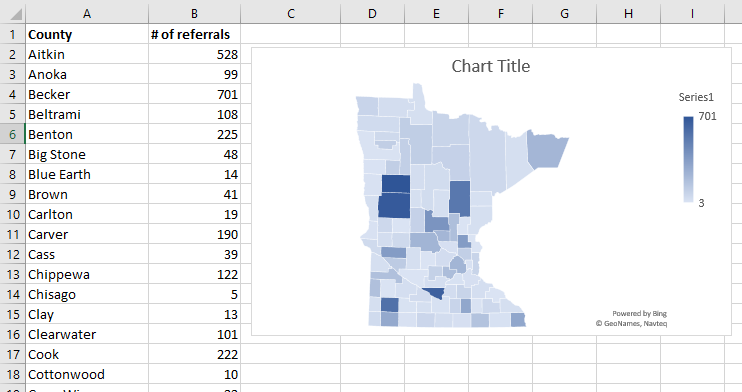
You can plot country/region, state/province, county, or postal code, on these maps but not cities or street addresses. The color scale can be a sequential 2-color scale (as shown) or a diverging 3-color scale. To create the map, Microsoft sends your data to Bing Maps, which may or may not be an issue if you are mapping sensitive data.
3. Merge shapes: I recently stumbled across the Merge Shapes command in PowerPoint, which might not be a new feature, but it was new to me. I learned that it can do some fun things when merging a picture with words for added impact. Check it out:

To access the Merge Shapes command, select at least two shapes, images, or text boxes that you want to merge. From the Drawing Tools tab, select the Merge Shapes drop-down menu and choose one of the five commands shown below.

For a description of each Merge Shape command, see this Indezine article.
We are excited to keep exploring Office 2016 to see what other new features or not-yet-discovered features it has!
The American Evaluation Association is celebrating Data Visualization and Reporting (DVR) Week with our colleagues in the DVR Topical Interest Group. The contributions all this week to aea365 come from DVR TIG members. Do you have questions, concerns, kudos, or content to extend this aea365 contribution? Please add them in the comments section for this post on the aea365 webpage so that we may enrich our community of practice. Would you like to submit an aea365 Tip? Please send a note of interest to aea365@eval.org. aea365 is sponsored by the American Evaluation Association and provides a Tip-a-Day by and for evaluators.
I can’t wait to use Merge Shapes. I hadn’t discovered that feature yet.
Useful tricks. Though using Office for such a long time, I still didn’t know about things you mentioned above up until now. Thanks for the post.
Anw, check out if you want to have instant spanish to english translation