
Hi! I’m Dave Shellard, the program evaluation manager at a professional association based in Washington, DC and Data Visualization and Reporting TIG (DVR TIG) Program Chair. As a founding member of the DVR TIG I’ve been a long advocate of incorporating meaningful and intentional data viz into communicating evaluation results.
Like many of us, I’m faced with tight resources for data visualization tools and I’ve found the older posts on this blog on free or low cost tools helpful. However, I often hit a snag for data analysis and viz tools – my data would land in the public domain as part of the agreement to use the free version and in some cases that can be beneficial. However, depending on the sensitivity of my data it is not always acceptable. I have had to scale back my expectations and look to build something myself in Microsoft Excel or PowerPoint.
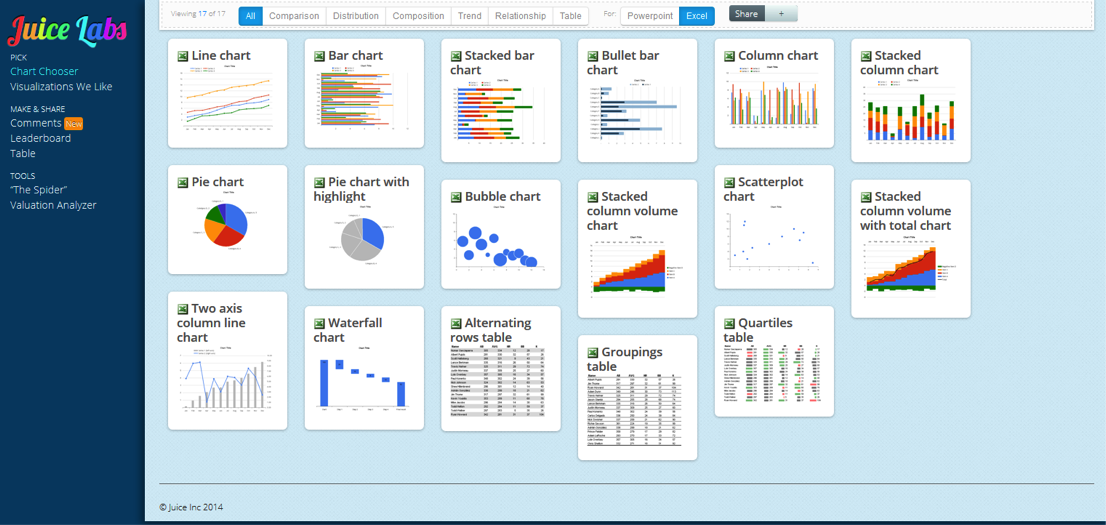
Rad Resource: Using the Juice Analytics Chart Chooser I can filter through the free tool for ideas and download a template in Excel or PowerPoint. Most importantly I can keep my data off of a third party server. Their templates also put our data first and fancy design second, helping me tell my story.
Rad Resource: I used the Speedometer Graph in Excel template to explore an idea for a project. My idea didn’t pan out but it was not due to my data needing to be uploaded to a third party server for presentation.
Rad Resource: A recently used the Map of the United States Google Document template to create a very basic heat map. I was in a pinch and this template worked perfectly to help illustrate my story. I did not have to upload any data and the document was stored in my Google Drive where I control the privacy settings.
Lesson Learned: Not every free template is created equal and some may lead you to a visualization that confuses your story may not score very high on the Data Visualization Checklist. With a little knowledge of Excel or PowerPoint you can convert any of these templates to match your style.
Have a free downloadable template that you like? Leave a link in the comments.
The American Evaluation Association is celebrating Data Visualization and Reporting (DVR) Week with our colleagues in the DVR Topical Interest Group. The contributions all this week to aea365 come from DVR TIG members. Do you have questions, concerns, kudos, or content to extend this aea365 contribution? Please add them in the comments section for this post on the aea365 webpage so that we may enrich our community of practice. Would you like to submit an aea365 Tip? Please send a note of interest to aea365@eval.org. aea365 is sponsored by the American Evaluation Association and provides a Tip-a-Day by and for evaluators.
The trade-off between privacy and convenience is unfortunate. With so many tools out there, it increases the risk of inadvertently leaving a trail of aggregate data behind for the public to misinterpret. This is certainly something to consider when using web-based tools for data visualization.