
Hey friends! We are Ann Emery, Co-Chair of the DVRTIG, and Stephanie Evergreen, Founder of the DVRTIG – two evaluators who are crazy about data visualization.
“I love your examples, but how do I know what I should do next time I’m creating a graph?” We heard comments like this when we talked with evaluators about good graph design. We saw that evaluators had thirst for better graphs and a clear understanding of why better graphs were necessary, but they lacked efficient guidance on how, exactly, to make a graph better.
Rad Resource: Introducing the Data Visualization Checklist
Take the guesswork out of your next graph. Download our 25-item checklist for clear guidelines on graph text, color, arrangement, lines, and overall messaging. Read about what makes a memorable graph title (spoiler alert: it’s not “Figure 1”). Learn how to arrange your bar chart based on whether your categories are nominal or ordinal. Decide which default settings in your software program to keep and which ones to toss.
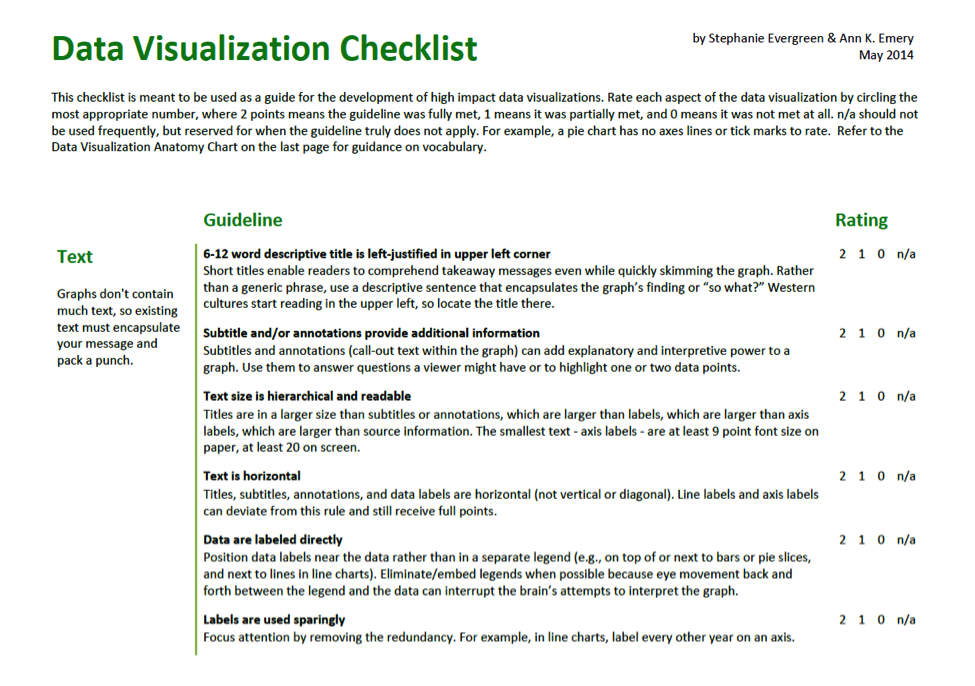
Not familiar with the terminology? The last page is a Data Visualization Anatomy Chart. Watch that example’s before-and-after remake in Stephanie’s training on Ignite presentations.
Hot Tip: How can you use the Checklist?
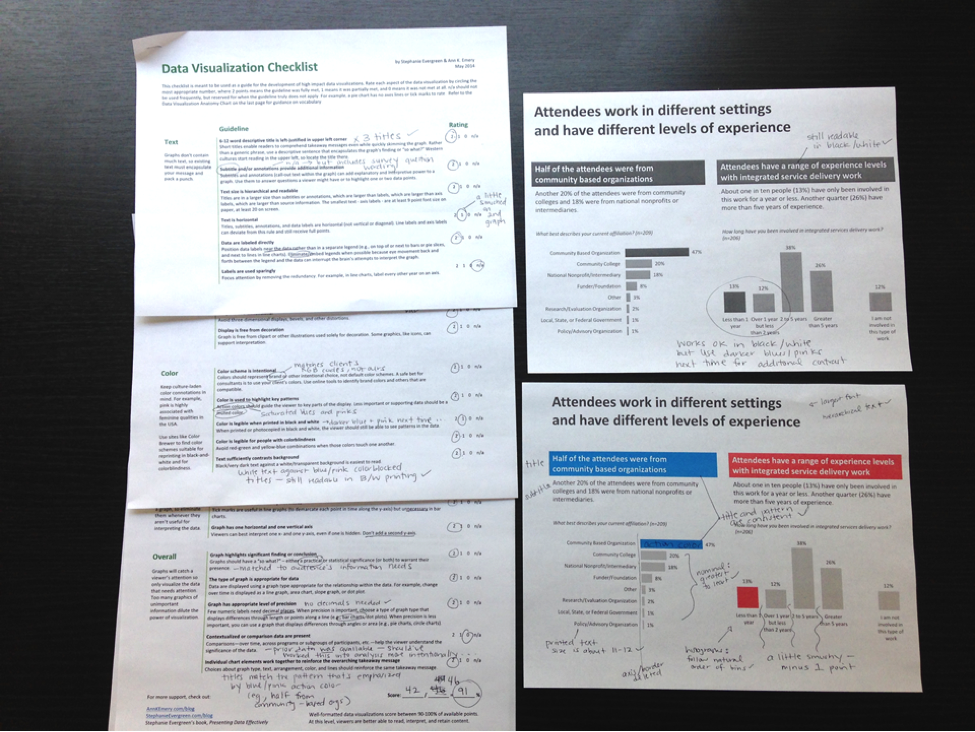
Get in the habit of producing several drafts before sharing final graphs with your clients. Draft, score, edit, repeat!
In this example, we printed an existing graph (page 6 here) in both color and black and white to see how the final chart looked for viewers. We scribbled notes all over the graph and the checklist as we scored. Overall, the graph earned 91% of the possible points—just above the cutoff that enables viewers to read, interpret, and retain the content.
Cool Trick: What’s next for the Checklist?
We are publishing examples to illustrate the 25 items as well as before-and-after remakes. Check out the growing galleries at http://annkemery.com/tag/data-visualization-checklist/ and http://stephanieevergreen.com/tag/data-visualization-checklist/. And we’re taking requests: Which checklist items would you like examples for?
We’re also hoping to present the checklist at the American Evaluation Association’s annual conference in October. Let’s high five there! Please please please can you take a picture of your existing data visualization, apply the checklist, and then take another picture? Tweet your redesigns to @annkemery and @evalu8r. Email them to annkemery@gmail.com and stephanie@evergreenevaluation.com. Fold them into paper airplanes and fly them to us! Send your redesigns and show people how awesome you are!
Big thanks to our pilot reviewers: James Coyle, Amy Germuth, Chris Lysy, Johanna Morariu, Jon Schwabish, David Shellard, Rob Simmon, Kate Tinworth, Jeff Wasbes, and Trina Willard.
The American Evaluation Association is celebrating Data Visualization and Reporting (DVR) Week with our colleagues in the DVR Topical Interest Group. The contributions all this week to aea365 come from DVR TIG members. Do you have questions, concerns, kudos, or content to extend this aea365 contribution? Please add them in the comments section for this post on the aea365 webpage so that we may enrich our community of practice. Would you like to submit an aea365 Tip? Please send a note of interest to aea365@eval.org. aea365 is sponsored by the American Evaluation Association and provides a Tip-a-Day by and for evaluators.
Pingback: DVR TIG Week: Dave Shellard on Keeping Your Data Out of the Public Domain by Using Free Downloadable Templates for Data Visualization and Reporting · AEA365
Pingback: John Murphy on Ode to the Annotation · AEA365