
Hello evaluation world! We are Kat Athanasiades and Veena Pankaj from Innovation Network.
This might sound familiar: you are given hundreds of pages of grant documents to make sense of. You are left wondering, “Where do I start?”

We were recently tasked with guiding evaluation for a funder’s national advocacy campaign, and had to make sense of advocacy data contained in 110 grants. Where did we start?
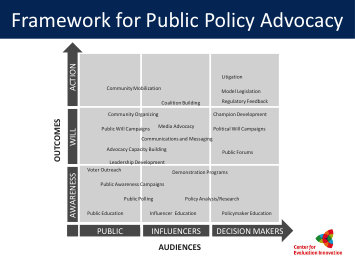
Julia Coffman’s Framework for Public Policy Advocacy (the Framework; Fig. 2), a comprehensive “map” of strategies that might be used in an advocacy campaign, was the perfect tool to analyze the grant reports. It let us identify and compare advocacy strategies employed by grantees individually, as well as step back and look at strategies used across the campaign.
Rad Resource: You can learn more about the Framework in Julia Coffman’s Foundations and Public Policy Grantmaking.
So how did we actually use the Framework to help us with analysis?
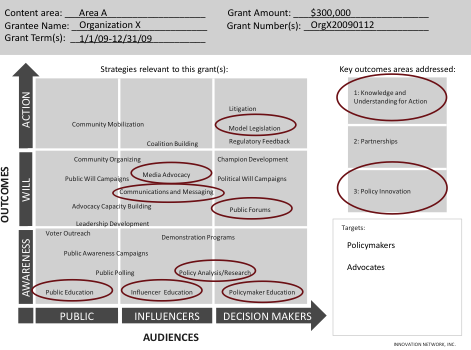
1. We reviewed grant reports and determined which strategies were used by each grantee. We created a top sheet to record this information (Fig. 3).
2. We entered the data into Excel, where it would be easy to manipulate into a visual, reportable format.
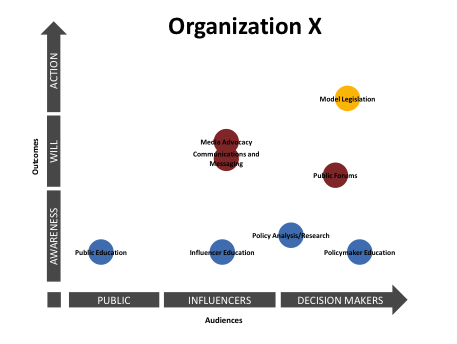
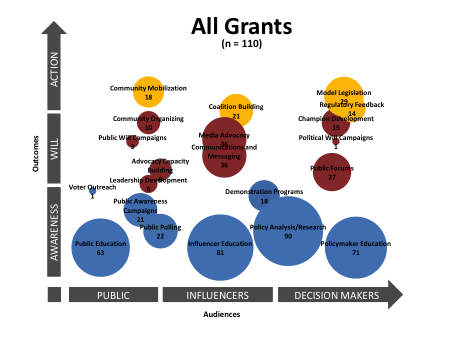
3. We created a series of “bubble charts” (a chart option in Excel) to display the information (Figs. 4, 5).
Hot Tip: If you’re designing data collection, the Framework provides a systematic way to sort grantees for further analysis based on the type of advocacy work they are engaged in.
Rad Resource: Want to learn how to make bubble charts? Check out Ann Emery’s blog to get help on constructing circle charts.
We would love to hear how you use the Framework in your work! Let us know via email or in the comments below.
The American Evaluation Association is celebrating APC TIG Week with our colleagues in the Advocacy and Policy Change Topical Interest Group. The contributions all this week to aea365 come from our AP TIG members. Do you have questions, concerns, kudos, or content to extend this aea365 contribution? Please add them in the comments section for this post on the aea365 webpage so that we may enrich our community of practice. Would you like to submit an aea365 Tip? Please send a note of interest to aea365@eval.org. aea365 is sponsored by the American Evaluation Association and provides a Tip-a-Day by and for evaluators.
Thanks for share This ,Help me A lot !!!!