
Welcome to the Social Network Analysis in Evaluation (SNA) TIG week on AEA365! My name is Stacey Friedman, and I am Co-Chair of the SNA TIG. I am the Associate Director of Evaluation and Planning for the Foundation for Advancement of International Education and Research (FAIMER), which works to improve education of health professionals around the world.
It is difficult to miss the increasing interest in “social networks.” Everything from social media to open office design concepts emphasizes social networks – patterns of relationships between people. Hand-in-hand with this is an interest among evaluation stakeholders in the “relationship” aspects of programs. Questions arise about, for example, the position of people or organizations in networks (e.g., who are key hubs of information and resources?), how individual characteristics (e.g., years of work experience, organization type) relate to network position, and the overall network structure (e.g., are there more collaborative relationships in the network over time?).
How can we as evaluators meet this need for insights into social networks? Social network analysis is an approach to studying networks of social relationships.
Hot Tip: If you search the AEA365 archives, you will find over 20 posts related to “social network analysis.” They note that using SNA in evaluation can help program stakeholders to:
– Examine relationships among individual entities (people, organizations, etc)
– See where individual entities stand in the network
– Understand communication redundancies and inefficiencies
– Reveal people who occupy key positions
– Reveal clusters in the crowd
– Foster collaboration
– Visualize the development of collaborations
– Study change/stability in network membership and structure over time
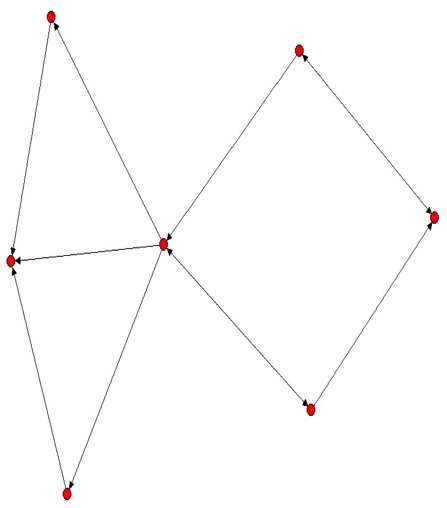
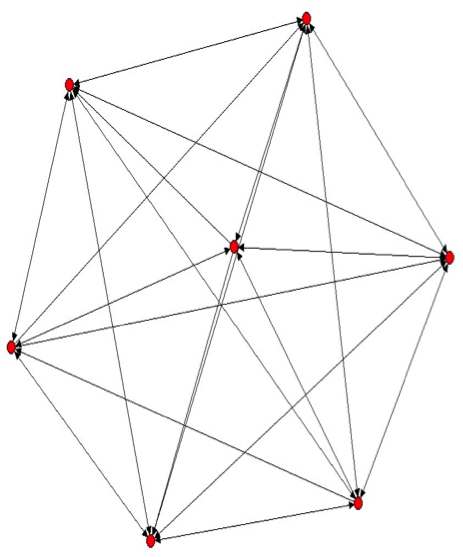
Hot Tip: SNA provides this information through a combination of both numeric data and visual graphics (sociograms). For example, it can provide numeric data about network “density.” Density indicates what proportion of all possible relationships in a network actually exist. So a density of 1 (or 100%) means that everyone in the network is connected to everyone else. And a density of 0.80 indicates that 80% of all possible relationships actually exist. This numeric information can be complemented by visual representations. For example, looking at the sociograms below, where each red dot represents an individual entity and each line represents a relationship – which one looks more dense?
Stay tuned this week for more about SNA-specific methodologies and tools – and how they can be applied within evaluations.
Rad Resource: Visit the SNA TIG website! Theresources page includes references, information about trainings, and more.
The American Evaluation Association is celebrating Social Network Analysis Week with our colleagues in the Social Network Analysis Topical Interest Group. The contributions all this week to aea365 come from our SNA TIG members. Do you have questions, concerns, kudos, or content to extend this aea365 contribution? Please add them in the comments section for this post on the aea365 webpage so that we may enrich our community of practice. Would you like to submit an aea365 Tip? Please send a note of interest to aea365@eval.org. aea365 is sponsored by the American Evaluation Association and provides a Tip-a-Day by and for evaluators.
Extra resources on SNA uses for evaluation:
The Use of Social Network Analysis Tools in the Evaluation of Social Change Communications By Dr Rick Davies, April 2009. 23 pages http://richardjdavies.files.wordpress.com/2008/04/2nd-draft-the-use-of-social-network-analysis-tools-in-the-evaluation-of-social-change-communications-b.doc
Participatory aggregation of qualitative information (PAQI)[or, Network visualisations of qualitative data]at http://mande.co.uk/special-issues/participatory-aggregation-of-qualitative-information-paqi/
Network models and Social Frameworks -for representing project contexts, plans and outcomes, at http://mande.co.uk/special-issues/network-models/