
Hello! I’m Sheila B. Robinson, aea365’s Lead Curator and sometimes Saturday contributor with a new cool tool to spice up your evaluation presentations and reports!
Do you know the feeling you get when you stumble upon something so good you want to share it, but then again, part of you wants to keep it all to yourself? It will be apparent from this post which side won out for me.
Lesson Learned: Based on advice from respected presentation and information designers, I now shy away from canned, cliche, or clip art images, including charts and diagrams. I’m no designer though, and often find it challenging to start with a blank page when I have something to share that calls for a good visual representation of a relationship.
I’ve enjoyed Microsoft’s SmartArt graphics that come with Office, and they are quite customizable, but with only 185 choices or so, I find I start recognizing them in other people’s presentations, especially when they are not customized by the user, and they begin to remind me of the overused, 20th century clip art we’ve all come to loathe.
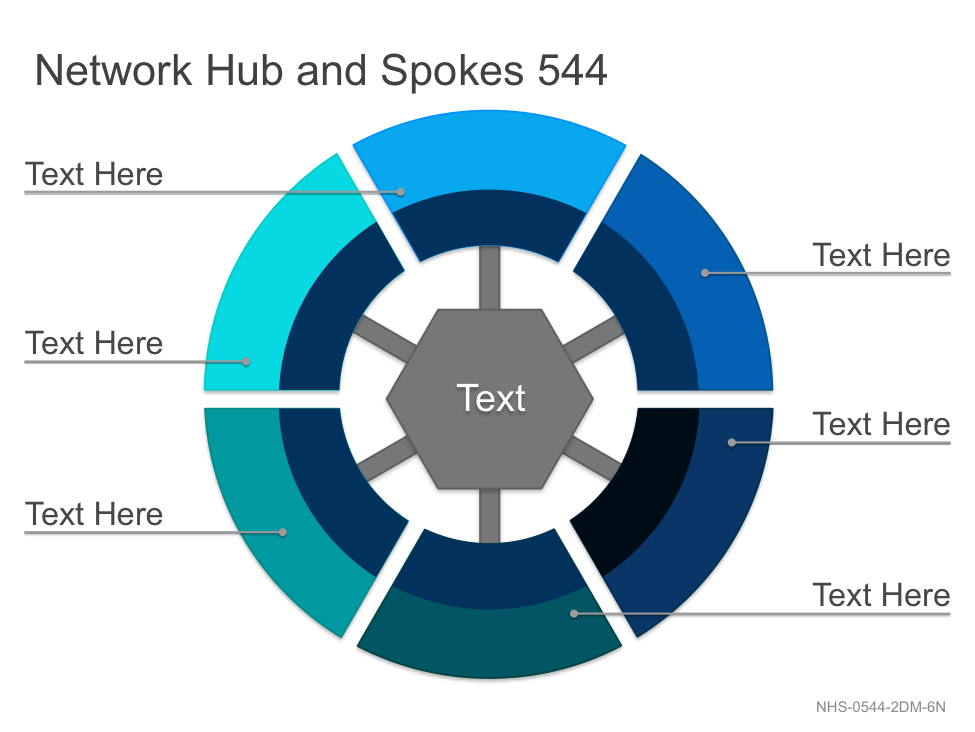
Rad Resource: Turns out, one of my favorite presentation designers, Nancy Duarte, has offered her expertise in a fabulous resource she has made available to all of us, and it’s FREE! Diagrammer™ is “a visualization system” featuring over 4,000 downloadable, customizable diagrams. Duarte, Inc. makes it easy to search for exactly what you need by allowing you to search all diagrams, or filter by relationship (flow, join, network, segment, or stack), style (2D or 3D), or number of nodes (1-8) needed.
Once you choose a diagram (and “shopping” for one is half the fun!), you simply download it as a PowerPoint slide, and fill in your text, or customize the various components. You can change shapes, colors, sizes and more. Diagrams range from the very simplest to somewhat complex. Here are just a few examples:
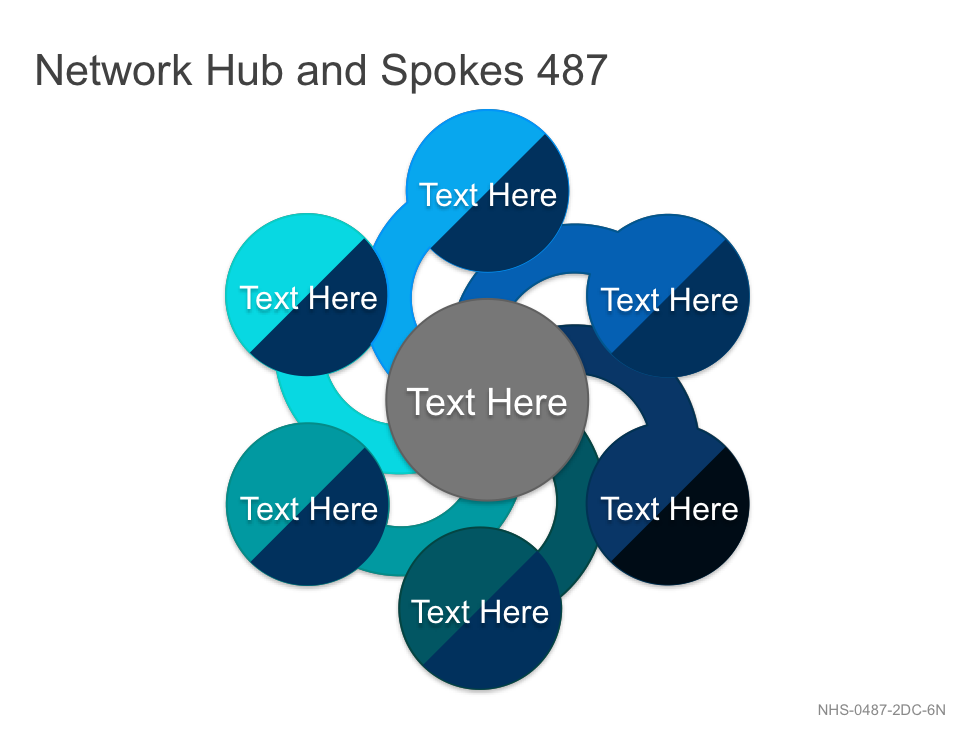


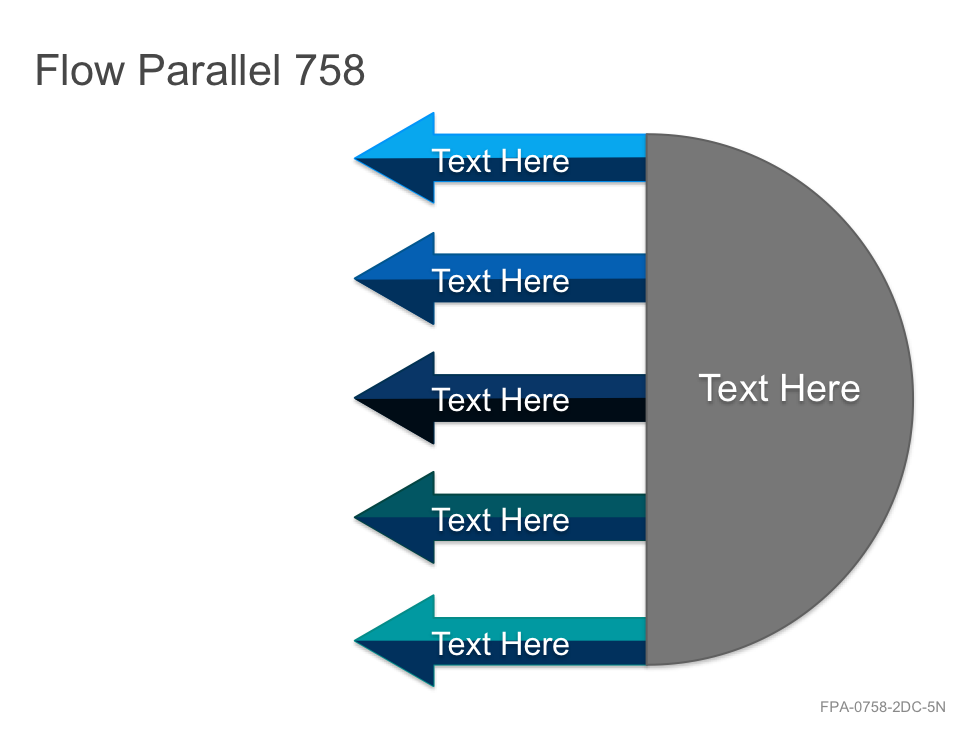
Most diagrams you see come in a variety of configurations. Each of the above examples are also available with different numbers of nodes.
Hot Tip: Duarte’s diagrams are in a gorgeous color palette if you ask me, but often it’s the colors you want to customize to match your report style or the colors of your organization. Here’s a before and after with the original digram, and my redesign.

Cool Trick: Take some time searching diagrams as you’re thinking about the relationship you want to communicate. This added reflection time will give you the opportunity to dig a little deeper into your data and you may be rewarded with new insights.
Do you have questions, concerns, kudos, or content to extend this aea365 contribution? Please add them in the comments section for this post on the aea365 webpage so that we may enrich our community of practice. Would you like to submit an aea365 Tip? Please send a note of interest to aea365@eval.org . aea365 is sponsored by the American Evaluation Association and provides a Tip-a-Day by and for evaluators.
Pingback: Sheila B Robinson on the Top Ten aea365 Articles of 2014! · AEA365
Thanks Sheila! This is a fantastic resource!