
My name is Jason Lawrence and I am a Management Fellow on the Economic Development and Intergovernmental Affairs teams for Leon County Government in Florida. I am also a recent graduate of the Master of Public Administration Program at the Askew School of Public Administration and Policy at Florida State University.
Local governments are the linchpins of our democracy in that these entities are able to provide optimal services to citizens, which means society is functioning at its most basic level. But how can citizens gauge how well a specific department within their local government, or the organization overall, performs in terms of service delivery and effectiveness?
Hot Tip: Statistical dashboards have become the most effective way of doing so. These online databases complement budget documents and annual reports and help residents keep track of what a local government does with taxpayers’ dollars. Dashboards are often presented as infographics, the data of which is taken from raw numbers reported by different departments to a central office, often at the executive level.
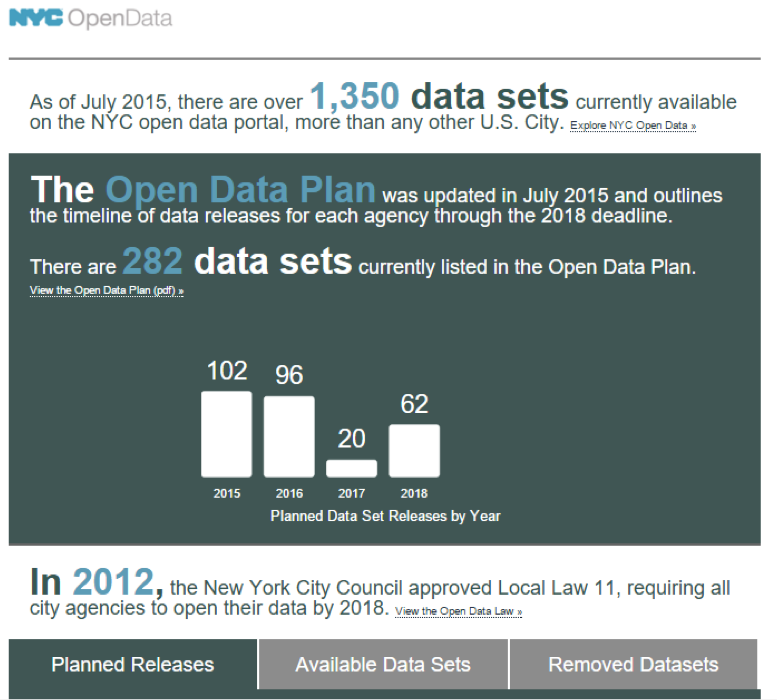
Source: https://data.cityofnewyork.us/dashboard
Lesson Learned: In local governments, for example, citizens may be interested in how many police arrests were made in the first quarter of the year. Or, how many tons of recyclable material has the solid waste department processed? While such quantitative performance data is useful in terms of invoking citizen engagement, it often dismisses service quality in favor of service quotas. Put more simply, numbers do not and cannot properly explain performance and leave out how citizens really feel about the local government services they receive as well as reflecting those citizens that have access and those that do not.
Hot Tip: Local governments considering or that already utilize a dashboard on their websites should, therefore, find ways to gather rich qualitative data to enhance performance reporting – whether it be included in a dashboard or within the pages of an annual report or budget document. This can be done by conducting surveys at community events or on a monthly basis through the main page of a website, and can be specific to a different department or service.
Adding a “human” element to performance reporting will not only shape the significance citizens place on local government, but could also help these entities better align their priorities with the pulse of their communities.
The American Evaluation Association is celebrating Southeast Evaluation Association (SEA) Affiliate Week with our colleagues in the SEA Affiliate. The contributions all this week to aea365 come from SEA Affiliate members. Do you have questions, concerns, kudos, or content to extend this aea365 contribution? Please add them in the comments section for this post on the aea365 webpage so that we may enrich our community of practice. Would you like to submit an aea365 Tip? Please send a note of interest to aea365@eval.org. aea365 is sponsored by the American Evaluation Association and provides a Tip-a-Day by and for evaluators.