
Hello! My name is Rebecca Reznik-Zellen and I am a librarian at the University of Massachusetts Medical School’s Lamar Soutter Library. If you are submitting a grant application, preparing your resume/curriculum vitae (CV) or Annual Performance Review (APR), or if you are going up for tenure or promotion, you may be thinking about how best to quantify your academic or scholarly performance as one way to showcase your experience. While there is no shortage of metrics that can be used to illustrate your contributions, it is sometimes puzzling to know which metrics to use, when and how to use them, or if you should rely on quantitative metrics at all. This post will review standard productivity and impact metrics, where to find them, and approaches for using them.
Lessons Learned:
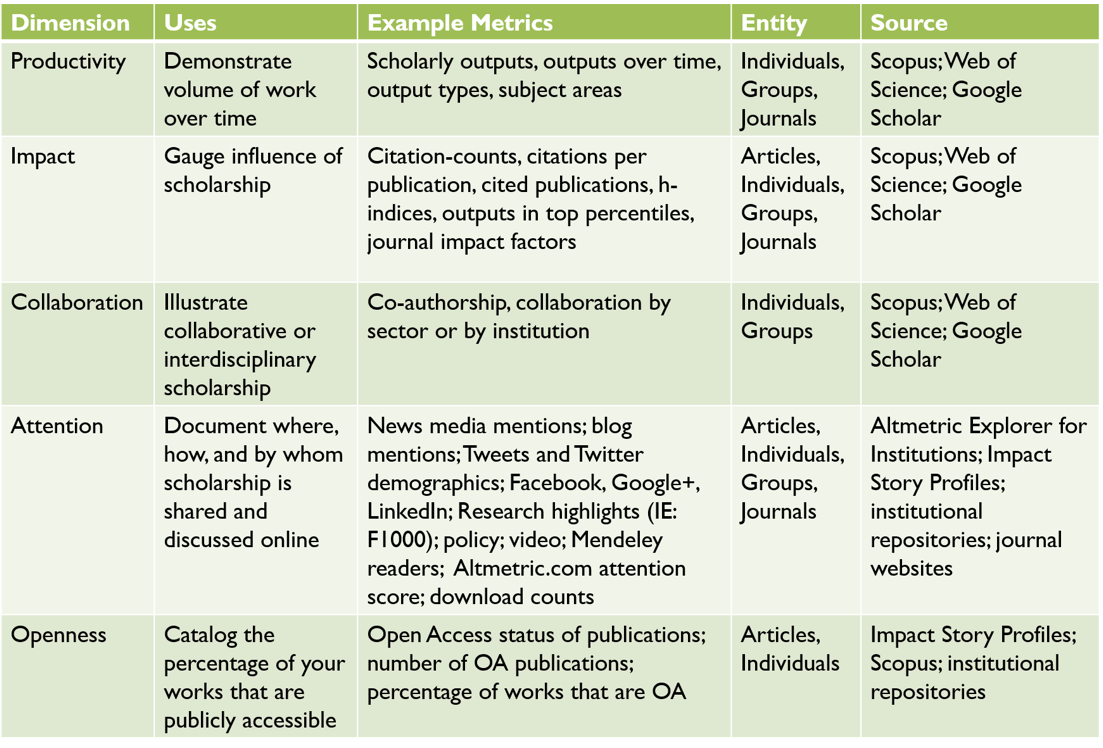
Scholarly metrics can be incredibly useful in illustrating the influence of your scholarly record, but if they are used carelessly or without context, they can become meaningless numbers. So what metrics should be used for what purposes? The following table gives an overview of different metrics, the dimensions of scholarship that they can help quantify, sample measures, and sources of these metrics.
Hot Tips:
- Follow the norms of your discipline and institution when including metrics on your CV or APR; some frown on including h-indices or citation counts, some use them sparingly, others integrate them creatively to highlight the most impactful work in otherwise dense documents.
- Indicate the source database for quantitative metrics as some databases (e.g., Scopus, Web of Science, and Google Scholar) will produce different numbers based on the content they index.
- Always use qualitative and quantitative metrics together when telling the story of your scholarship.
- Look behind the numbers to see where and by whom your work is being cited or shared; this qualitative information is often more telling than a simple statistic.
Rad Resources:
The following tools can help you gather scholarly metrics on productivity and impact, collaboration, openness, and online attention.
- Productivity and Impact: Scopus and Web of Science (if provided by your institution) or Google Scholar (free) provide data on the number, type, and source of your publications and can also provide (to differing degrees) statistics such as h-indices and citation counts.
- Collaboration: Try Scopus Author Analysis to see who your most frequent collaborators are. Google Scholar also provides information on coauthors.
- Attention: Use Altmetric Bookmarklet (free) or Altmetric Explorer for Institutions (if provided by your institution) to discover the online attention your scholarship receives.
- Openness: Try Impact Story Profiles to determine the percentage of your outputs that are Open Access.
- Broader Impact: Explore the Becker Modelto see how broad your scholarly impact is.
How do you document impact within your field? Use the comments section below to share your own preferred metrics and strategies for documenting your scholarly performance. And, as a reminder, you may wish to contact your local librarian if you want help understanding different metrics and how to use them.
Do you have questions, concerns, kudos, or content to extend this aea365 contribution? Please add them in the comments section for this post on the aea365 webpage so that we may enrich our community of practice. Would you like to submit an aea365 Tip? Please send a note of interest to aea365@eval.org. aea365 is sponsored by the American Evaluation Association and provides a Tip-a-Day by and for evaluators.