
Hello! I’m Molly Ryan, a Research Associate at the Institute for Community Health (ICH), a non-profit in Cambridge, MA that specializes in community based participatory research and evaluation. I am part of the team evaluating the Central Massachusetts Child Trauma Center (CMCTC) initiative, which seeks to strengthen and improve access to evidence-based, trauma-informed mental health treatment for children and adolescents. I would like to share a great resource that we use to visualize and communicate findings with our CMCTC partners.
Rad Resource: Icon Array University of Michigan researchers developed Icon Array to simply and effectively communicate risks to patients. For more information on why icons are so rad, check out Icon Array’s explanation and bibliography.
Hot Tip: Icon Array offers 5 different icons to choose from.
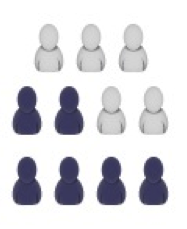
Hot Tip: Icons aren’t just for risk communication! We use icons to help our partners understand and visualize their progress collecting reassessment data for clients.

• 9 out of 14 (64.3%) complete
• 5 out of 14 (35.7%) incomplete
Cool Trick: Icon Array allows you to illustrate partial risk by filling only a portion of the icon. We used this feature to communicate whether a reassessment was complete or incomplete for a given client.
Do you have questions, concerns, kudos, or content to extend this aea365 contribution? Please add them in the comments section for this post on the aea365 webpage so that we may enrich our community of practice. Would you like to submit an aea365 Tip? Please send a note of interest to aea365@eval.org . aea365 is sponsored by the American Evaluation Association and provides a Tip-a-Day by and for evaluators.
Pingback: Sheila B Robinson on the Top Ten aea365 Articles of 2014! · AEA365
Thank you so much for sharing this tool! I’m an epidemiologist who is constantly looking for creative and clear ways to communicate data. I also appreciate the bibliography of evidence – thank you!!