
Hello evaluation community, I am Johanna Morariu, Director of Innovation Network. Do you like getting something for free? Me too! Using Twitter data of the use of #eval13 I will demonstrate how to get started with network analysis in NodeXL. 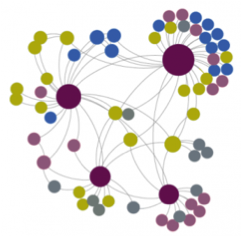
Were you at Evaluation 2013 in Washington, DC? Thousands of evaluators converged to talk methods, data, and analysis. It was awesome! And what better way to celebrate an evaluation conference than with more evaluation?!
Social Network Analysis (SNA) is a dataviz approach for data collection, analysis, and reporting. Networks are made up of nodes (often people or organizations) and edges (the relationships or exchanges between nodes). The set of nodes and edges that make up a network form the dataset for SNA.
Cool Trick: There are four basic steps to creating a social network map in NodeXL: get NodeXL, open NodeXL, import data, and visualize. Let’s get started with our analysis of #eval13 SNA! Click here for the interactive step-by-step NodeXL instructions.

Lessons Learned: Alright, let’s look at that #eval13 data!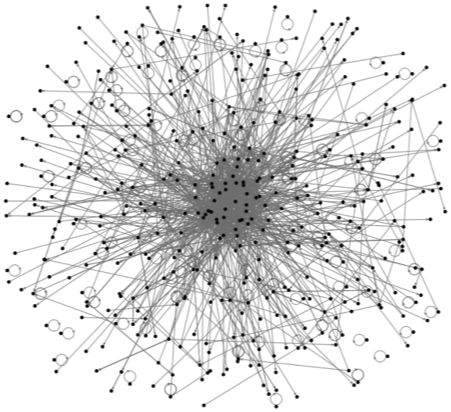
The data covers about 8 days (from Tuesday, October 15 @ 7:19p ET through Wednesday, October 23 @ 5:13p).
There were 433 nodes, or 433 Twitter users tweeting with #eval13.
What does that mean in relation to conference attendance? More than 3,000 people attended the conference, so for about every seven people at the conference there was one person who tweeted about the conference. Pretty cool!
There were 2264 edges, or 2264 interactions between Twitter users using #eval13. (Of those, 925 were unique edges.)
Who’s at the center of the #eval13 network? For those of you active on #eval13 these names are likely very familiar! 
- Ann Emery (@annkemery)
- Chris Lysy (@clysy)
- Allison Titcomb (@allisontitcomb)
- Innovation Network (@innonet_eval)
- Jane Davidson (@ejanedavidson)
What do you see when you look at the #eval13 network? To do your own analysis of the dataset, access it here.
Do you have questions, concerns, kudos, or content to extend this aea365 contribution? Please add them in the comments section for this post on the aea365 webpage so that we may enrich our community of practice. Would you like to submit an aea365 Tip? Please send a note of interest to aea365@eval.org . aea365 is sponsored by the American Evaluation Association and provides a Tip-a-Day by and for evaluators.
Hello!
I would like to use the algorithm ‘spring embedding’, but I cannot find it.
Thank you very much.
Best wishes!
We call it “Fruchterman Reingold” and you can find it in the NodeXL>Graph Pane>Layout Options menu.
Additional technical support can be found on the NodeXL community site at http://nodexl.codeplex.com
Regards,
Marc
I have posted additional maps of the AEA 13 data in a pdf on my website under News, on the front page.
http://durlandconsulting.com/
Thanks Maryann! Maybe you’ll consider a future aea365 post sharing your SNA knowledge, for example, about when/why to use a spring embedded map!
NodeXL has a feature called “Options” that can be thought of as a “recipe” for your data.
I have a Twitter recipe that generates the style of results you can see in the NodeXL Graph Gallery
http://nodexlgraphgallery.org/Pages/Default.aspx?search=sna
A specific example is the map of connections among people who tweet about malaria: http://nodexlgraphgallery.org/Pages/Graph.aspx?graphID=11528
The recipe file for this dataset is linked from the bottom of most pages on NodeXL Graph Gallery, for example, the malaria map “recipe” is located here:
http://nodexlgraphgallery.org/Pages/WorkbookOptions.ashx?graphID=11528
To apply a recipe file to your own data set, in NodeXL, select the NodeXL>Options>Import menu item and select the file downloaded from the link above.
Once a “recipe” file is in place, select NodeXL>Graph>Automate>Run to process the raw data into a final form.
You can upload your results into the NodeXL Graph Gallery via the NodeXL>Data>Export menu. This is a useful way of sharing your results.
Thanks for the interest in NodeXL!
–
Marc
Hi Marc, just so readers are clear, that is not an updated map of the same data, but a grab of a different hashtag #eval (vs. #eval13) over a different period of time. Right? Thanks for sharing with our AEA community!
Correct. The graph at http://bit.ly/1foXIBi represents a network of 189 Twitter users whose recent tweets contained “#eval”. The network was obtained from Twitter on Friday, 08 November 2013 at 16:10 UTC. The tweets in the network were tweeted over the 7-day, 15-hour, 49-minute period from Thursday, 31 October 2013 at 23:57 UTC to Friday, 08 November 2013 at 15:47 UTC.
Here is an updated #eval network map created with NodeXL:
http://bit.ly/1foXIBi
Shhhhhh please don’t tell my boss how much time I’m spending on twitter….
Coincidentally, her name is also Johanna Morariu and she’s also Director at Innovation Network. What a small world! 🙂