
Hi, my name is Jason Ravitz, an Independent Research and Evaluation Professional and former Director of Research for the Buck Institute for Education, where my job included evaluating project-based learning (PBL) impacts.Here is a district-level approach developed with Melissa “Missy” Rowe, Executive Director of Assessment and Research at Grand Prairie ISD in Grand Prairie, TX.
This approach addresses key concerns about selection bias, that teachers who implement instructional reforms are systematically different from others. The trick is to compare student performance for the same teacher and students during testing periods when the intervention was and was not used.
Cool Trick: Parentheses represent “optional” steps for added value.
1. Make a list of participating teachers (with background and treatment data)
2. Identify tested standards for each testing period (and the most relevant ones)
3. Find out which teachers implement during each testing period (rating their implementation, when possible
4. Obtain district- and teacher-level averages, for each course, for each standard and testing period (excluding teacher from district overall)
5. Calculate differences from the district average for each teacher, testing period and standard
6. Calculate the average of differences for each teacher, with and without the intervention (teacher-level analysis)
7. Calculate the average of differences for all teachers (district-level analysis)
Lesson Learned: Benefits: Results can provide a rigorous measure of impacts, effectively controlling for teachers and students by comparing their performance (against themselves and the district) with and without the intervention. In addition, the results can shape professional development and ongoing research based on findings for each standard.
Example: A few key standards are shown for geometry Teachers A and B during Testing Period 1 (neither used PBL) and Testing Period 4 (when both used PBL).
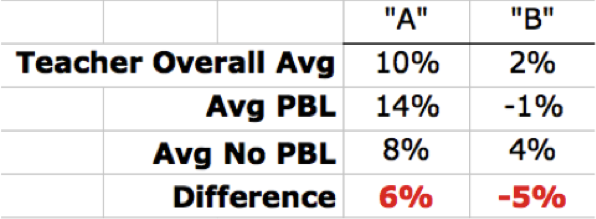
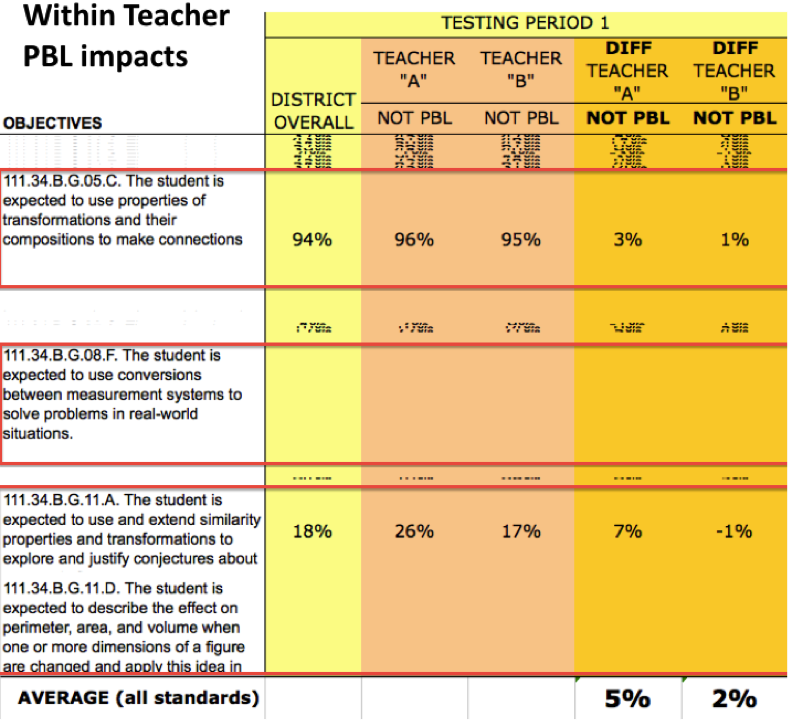 Teacher A’s students had slightly better than district average (+5%) performance during Testing Period 1, but substantially better performance (+14%) during Testing Period 4, when PBL was used. The same result was not seen for Teacher B, whose students appeared to perform slightly better without PBL.
Interestingly, Teacher A had three PBL-related professional development sessions, while Teacher B only had one.
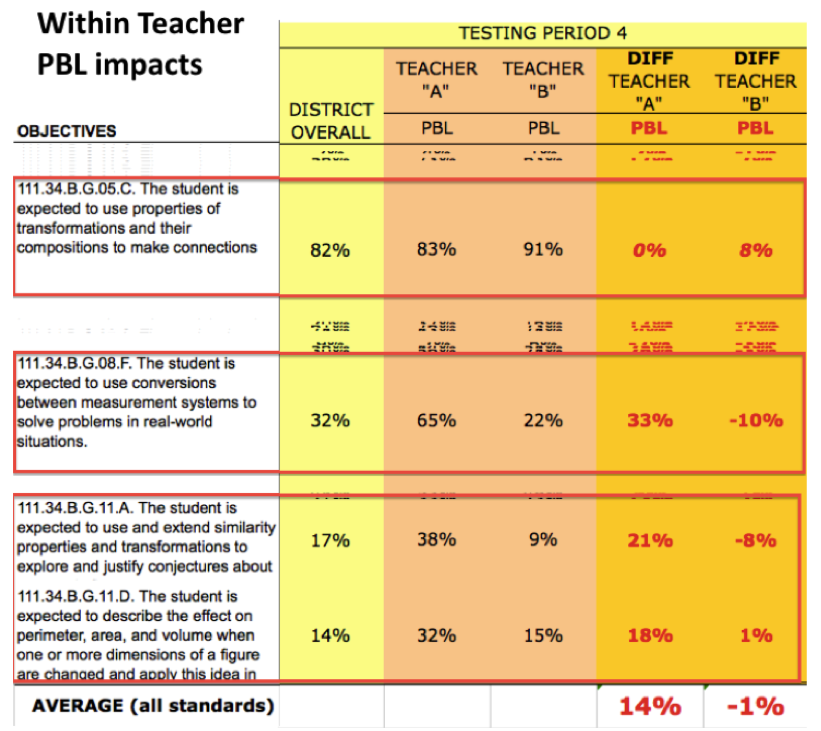
We see several standards for which Teacher A could provide insights about using PBL effectively (e.g., the second standard on using conversions in real-world situations). However, Teacher B was more successful using PBL to teach the first standard that is shown (properties of transformations).
Note. Averages reflect all testing periods and standards, not just the few that are visible.
Replicated for all PBL-using teachers in the district these results could be useful for decision makers and for guiding research and professional development based on cases where PBL was effectively used to teach the standards.
What do you think?
Do you have questions, concerns, kudos, or content to extend this aea365 contribution? Please add them in the comments section for this post on the aea365 webpage so that we may enrich our community of practice. Would you like to submit an aea365 Tip? Please send a note of interest to aea365@eval.org . aea365 is sponsored by the American Evaluation Association and provides a Tip-a-Day by and for evaluators.
Thank you for the kind words, Felix. It was a pleasure talking to you. As we discussed, a key to this design is the projects were intended to be taught during a specific period and to address specific standards. The analysis I showed does not distinguish, but a next step would be to focus on standards that were meant to be the focus for each project, to see if this is where we are getting the 33 vs. 0%s.
I understand you cannot use this design because people are focused on year-long projects, so there is never a comparison condition where they are not being taught. My only suggestion is to recommend mini-projects along the way. Otherwise, you are stuck with looking for really strong end of year measures, which is precisely what I am running away from using.
~ Best of luck! ~
Any additional comments would be great!
Jason – Thanks so much for making yourself available to answer my questions about your design. I was particularly interested to learn that district assessments were used every nine weeks. It sounds like that was definitely advantageous for your data collection and allowed you to capture some good data around the use of PBL district-wide. Thanks again for sharing!