
We are Ana Flores and Joshua Paul at Volunteers of America – Los Angeles. At the AEA Evaluation 2016 conference, we presented a panel entitled “A Picture is Worth a Thousand Words…But Will They Use It?”. Today, we want to provide additional information regarding how to make data more user-friendly.
The Evaluation Department at Volunteers of America – Los Angeles (VOALA) is tasked with providing evaluation services as needed to more than 70 social service programs. Staff in these programs are dedicated to helping people and many find data unappealing. Addressing communication barriers has given us the opportunity to learn a number of lessons.
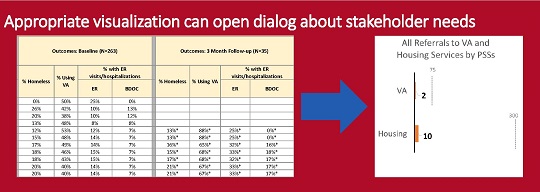
Lessons Learned #1: Needs Change, Open a Dialog with Succinct Visualizations
Understanding stakeholder needs and how they fit into a program model is a major part of any evaluator’s task. Unfortunately, we have found that stakeholder needs and program models can change rapidly, and stakeholders do not always volunteer information about these changes.
We were once mystified as to why one of our programs — whose initial purpose was to connect with and refer homeless veterans to local services — had such poor monitoring results. Traditional reporting methods failed to open a dialog that could bring the core problem to light. After months of discussion, we tried a new visualization-based design (see image) that demonstrated the discrepancy between the goal and present performance and prompted program leadership to identify the issue. The staff had been focused on the transportation of clients to appointments, a secondary program activity, which had not originally been designated as important to track.
Lessons Learned #2: Only Show What You Need to Show
Past reports for many of our programs provided detailed data, presenting every single outcome for individual clients. However, this level of information was not necessary for program performance discussions and was a distraction from the overall outcomes included in the report. Using Tableau, the detailed information was removed, and only overall outcome percentages and targets were kept on the graph. With outcomes presented this way, VOALA upper management was able to get the information they needed to make program recommendations and help program directors implement better practices.
Lessons Learned #3: Use Interactivity
Giving your audience an opportunity to control the data makes it easier for them to make inferences about the information. Visual analysis programs, like Tableau, allow us to provide interactive reports so that upper management and program directors can filter results by key demographics or periods of time, depending on what is useful to them.
Having these types of “quick snapshot” visualizations has helped upper management at VOALA communicate recommendations with programs.
Experimenting with these different data visualization techniques has improved our discussions with key staff, helping us ask hard questions while reducing staff resistance to data. Otherwise, the response to “Why is this benchmark never reached?” might just be silence.
The American Evaluation Association is celebrating Internal Evaluation (IE) Topical Interest Group Week. The contributions all this week to aea365 come from our IE TIG members. Do you have questions, concerns, kudos, or content to extend this aea365 contribution? Please add them in the comments section for this post on the aea365 webpage so that we may enrich our community of practice. Would you like to submit an aea365 Tip? Please send a note of interest to aea365@eval.org. aea365 is sponsored by the American Evaluation Association and provides a Tip-a-Day by and for evaluators.