
Hello from two scholars and two coasts! We are Mike Osiemo Mwirigi, MS, and Glen Acheampong, MPP. During our GEDI program year, we learned that evaluators and stakeholders are increasing their use of visuals to present data. Data visualization pioneers in evaluation have pointed out that a good visual can make evaluation results more user friendly. Effective visuals capture people’s attention, substitute for text and help reduce the lethargy of reading long reports. Last, they can tell a more memorable story.
We noticed that when talking about data visualization, cultural competency rarely comes up. Cultural competency in evaluation is the ability to engage with diverse stakeholders to “include cultural and contextual dimensions important to the evaluation” (American Evaluation Association, 2011). Data visuals can be interpreted differently based on cultural differences and, as a result, we interpret and react differently to the same stimulus.
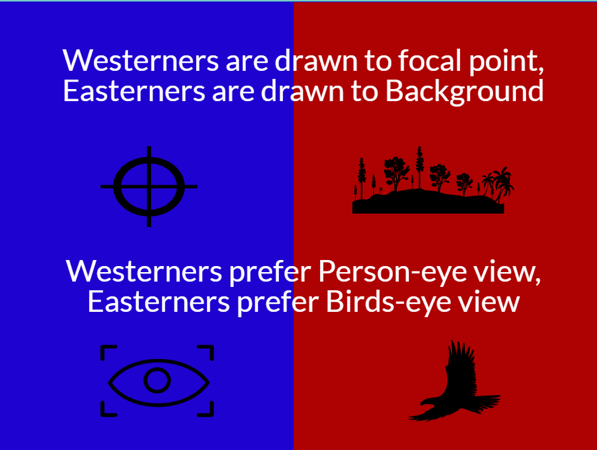
The documentary West and East, Cultural Differences discusses how Easterners (Chinese, Japanese and Korean) and Westerners (Americans and Europeans) are tuned to differently interpret visual information. The documentary shared the following:

Hot Tip 1: Begin with a plan.
Data visualization can lose the intricacies of the story its telling. Further, some data visuals are complex and hard to interpret without an explanation. Evaluators should consider data visualization from the onset of the evaluation design to navigate exactly what the image should convey.
Hot Tip 2: Check and reflect stakeholders’ interpretations of data visuals.
When interpreting data visualization guidelines or rules of thumb we must note that these are not universal; what works for one population might be counterproductive for another. This is true for constructed meanings around colors, shape, and symbols. Instead, explore what stakeholders need and can digest.
Rad Resources:
American Evaluation Association. (2011). American Evaluation Association Public Statement on Cultural Competence in Evaluation. Fairhaven, MA. Retrieved from www.eval.org.
EBS. (2012, December 05). West and East, Cultural Differences. Retrieved July 06, 2017, from https://www.youtube.com/watch?v=ZoDtoB9Abck&index=302&list=LLaTQQZHp4uDV7ubqPoaq4NQ
Emery, A. K., & Evergreen, S. (2014). Data Visualization Checklist. http://stephanieevergreen.com/dataviz-checklist/
Links to West and East, Cultural Differences
Part 1: https://www.youtube.com/watch?v=ZoDtoB9Abck&index=302&list=LLaTQQZHp4uDV7ubqPoaq4NQ and
Part 2: https://www.youtube.com/watch?v=709jjq8qk0k&t=4s
The American Evaluation Association is celebrating Graduate Education Diversity Internship (GEDI) Program week. The contributions all this week to aea365 come from AEA’s GEDI Program and its interns. For more information on GEDI, see their webpage here: http://www.eval.org/GEDI Do you have questions, concerns, kudos, or content to extend this aea365 contribution? Please add them in the comments section for this post on the aea365 webpage so that we may enrich our community of practice. Would you like to submit an aea365 Tip? Please send a note of interest to aea365@eval.org. aea365 is sponsored by the American Evaluation Association and provides a Tip-a-Day by and for evaluators.
Hello,
My name is Justin Lue and I am currently a student in the Professional Masers of Education Program at Queen’s University. I am currently taking a course called “Program Inquiry and Evaluation.”
I came across this article and found that it resonated me in many ways. I think data visualization is something that is needed in most reports. I think a presentation full of data, numbers, and speeches, simply gets boring. Visualizations are something that catches the eye and help remember what is being conveyed.
The idea of visualizations, pictures, and symbols meaning something different for those from the east and west is something that I am constantly working with. I currently work at a private school in Toronto where the main demography is Chinese. When teaching them I have to ensure that the visuals I use are culturally sensitive to them as some visuals may mean one thing to them and another thing to me. It was great to read your article and finally have some information on the matter. Your work and visualizations reminded me of a book called “East Meets West,” by Yang Liu. It is a simple picture book that shows the difference in ideaology and difference in thoughts between Germany (west) and China (east). Did the book have any influence over your work on visualization?
As a final inquiry, I was wondering if you came across any sort of visual or symbol that you should never use when working with certain demographics. Has there been any instances where a visualization you thought harmless, has caused issue with individuals you were presenting data to?
Thank you for your time and thank you for sharing such an informative article.
Justin Lue