
My name is Pam Larson Nippolt and I am a University of Minnesota Extension Evaluation and Research Specialist working with a team of program evaluators in 4-H youth development programs.
Lesson Learned: Monitoring enrollment data is often a data-related activity that falls under the umbrella of program management. Monitoring enrollment data enables program leaders to pay attention to some aspect of program implementation via inputs or outputs. What is monitored can be quite distinct, but it still can inform the focus of an evaluation or measurement of an outcome.
When planning with program teams, I use the example that monitoring is similar to setting a metronome while playing piano–it keeps a steady beat going to help the pianist stay in tempo. Evaluation, on the other hand, is the assessment the pianist and audience make about the music created.
Lesson Learned: Collecting, maintaining, and analyzing data for monitoring purposes are an investment of time and resources that can pay dividends for evaluation in the long run!
Enrollment databases, used in many large youth development programs, are excellent data sources for program monitoring, but are often overlooked. For example, in 4-H, program data (shown below) revealed that a region with the largest Metropolitan area (Central Region) enrolled more youth from farms and small towns than what had been believed to be the case.
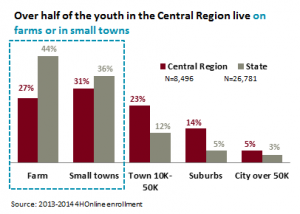
This finding seemed to be counter-intuitive and led to further investigation of the data. We discovered that many youth living in the city and participating in the program were not in the enrollment database because of a particular enrollment practice.
Monitoring the enrollment data led to an awareness about the need to make the process more accessible for all youth and families. Program staff may not have identified the scale of this discrepancy without this type of monitoring.
Hot Tip: Get started by “whetting the appetite” of your program partners for data use with available data about the program and participants. Build appealing and visually engaging graphics to make the using the data rewarding to staff who don’t typically attend to data. Ask questions and listen to how they make sense of the data. This practice will reveal what can be monitored “right now” for team learning.
Rad Resource: Consider investing in making your enrollment database more usable and accessible to staff with trend and comparison features. Interfaces can be designed for your enrollment software that provide a dashboard with menus to track changes over program years and geographic comparisons. Think like an interface designer to create tools and reports that will help program staff love their data!
The American Evaluation Association is celebrating Extension Education Evaluation (EEE) TIG Week with our colleagues in the EEE AEA Topical Interest Group. The contributions all this week to aea365 come from our EEE TIG members. Do you have questions, concerns, kudos, or content to extend this aea365 contribution? Please add them in the comments section for this post on the aea365 webpage so that we may enrich our community of practice. Would you like to submit an aea365 Tip? Please send a note of interest to aea365@eval.org. aea365 is sponsored by the American Evaluation Association and provides a Tip-a-Day by and for evaluators.