
Hello! We are Lloyd Bingman (Brighter Day Consulting, LLC and evaluator of an NSF STEM project) and Pat Jessup (InSites associate and coPI for ECLIPS). We’re here to talk about the “Patterns” portion of theiceberg diagram displayed on Monday of ECLIPS week.
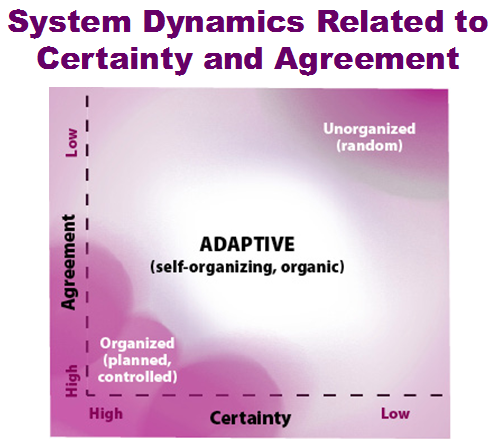
Both of us evaluate programs that are part of complex social systems that have multiple and dynamic patterns. An application of complexity theory provides us with a way to understand and distinguish among three patterns of system dynamics:
- Organized patterns: With high agreement and high certainty in the system, the patterns appear fairly predictable.
- Self-organizing: With a middle range of agreement and certainty, the patterns are adaptive.
- Unorganized patterns: With low agreement among key players and low certainty, patterns may not be present.
Creating a Robot Diagram to Understand Coordinator’s Role in a Complex System
When we talked about systems dynamics in the ECLIPS, I (Lloyd) discovered a systems lens for evaluating a project I was working on. I envisioned a key project leader superimposed on the diagram of systems dynamics. The leader is attempting to connect all of the project parts with their different dominant patterns of movement.
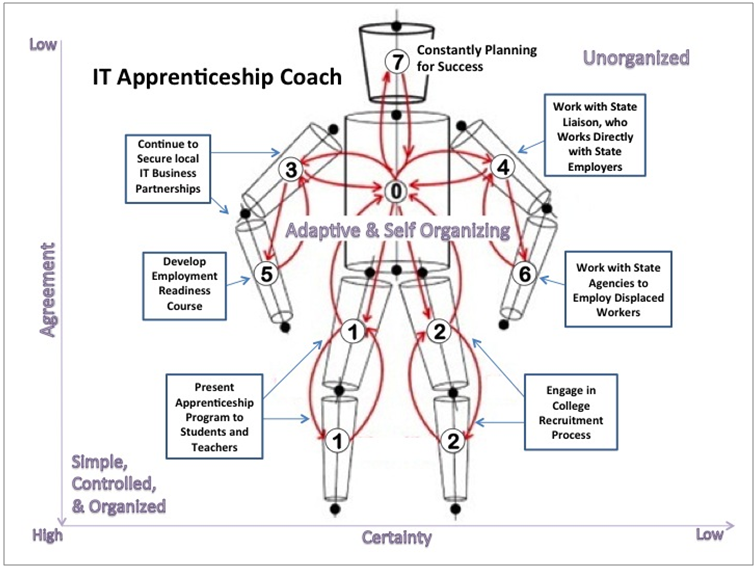
In this illustration, the “robot” figure is the IT Apprenticeship Coordinator. The Coordinator brings all the pieces together to meet program goals. The numbers on the robot correspond to different program goals.
At the bottom left (#1), the goal of presenting the apprenticeship program is controlled and organized; the Coordinator has direct control of presentations. The other goals on the left side (#3, 5) tend to be fairly predictable but key players do not agree as much on these goals as on the #1 goal.
On the right side of the robot, the activities related to the three goals are more self-organizing or unorganized. The college recruitment process goal (#2), bottom right side, is less certain than #1 because the college competes with other colleges at recruitment events. Moving up the right side, the approaches to reaching the goals (#4, 6) are increasingly unorganized.
At the head of the diagram (#7), the Coordinator is constantly planning, assessing, and implementing activities to ensure project success.
Insights Gained from the Robot Diagram
This image provided new insight into the relationships among the parts and where changes could lead to a more networked flow of information. For example, by strengthening the relationship with the state liaison (#4), I (Lloyd) was able to gain data on the state workers’ experiences with the apprenticeship program.
Join us tomorrow when Dave, Ginger, and Alyssa talk about identifying leverage points for changing a system.
Rad Resources
- Using Complexity Science Concepts in Evaluation
- Designing initiative evaluation: A systems-oriented framework
The American Evaluation Association is celebrating this week with our colleagues involved in ECLIPS—Evaluation Communities of Learning, Inquiry, and Practice about Systems—and the AEA Systems in Evaluation Topical Interest Group. Do you have questions, concerns, kudos, or content to extend this aea365 contribution? Please add them in the comments section for this post on the aea365 webpage so that we may enrich our community of practice. Would you like to submit an aea365 Tip? Please send a note of interest to aea365@eval.org. aea365 is sponsored by the American Evaluation Association and provides a Tip-a-Day by and for evaluators.