
Hi! I’m Katherine Shea. Global Forest Watch (GFW) is one of many groups aiming to improve accountability through transparency by providing open data — in this case geospatial environmental data identifying deforestation in near-real time. Our goal is to reduce deforestation. Demonstrating that we’ve had an impact, through credible, visible data, is a unique challenge.
Over 1 million people have been to GFW’s website. But in the age of anonymous Internet users, how do we know whom we are reaching? How do we know how our data is used? The team at GFW uses three methods to answer these questions: Google Analytics, drop-ins who contact us on their own, and networks linked to GFW via staff and partners. Each of these methods has its weaknesses.
Lessons Learned:
- Analytics
According to Google Analytics, Global Forest Watch has been visited by people in every country. The data provide some insights, but only tells part of the story.
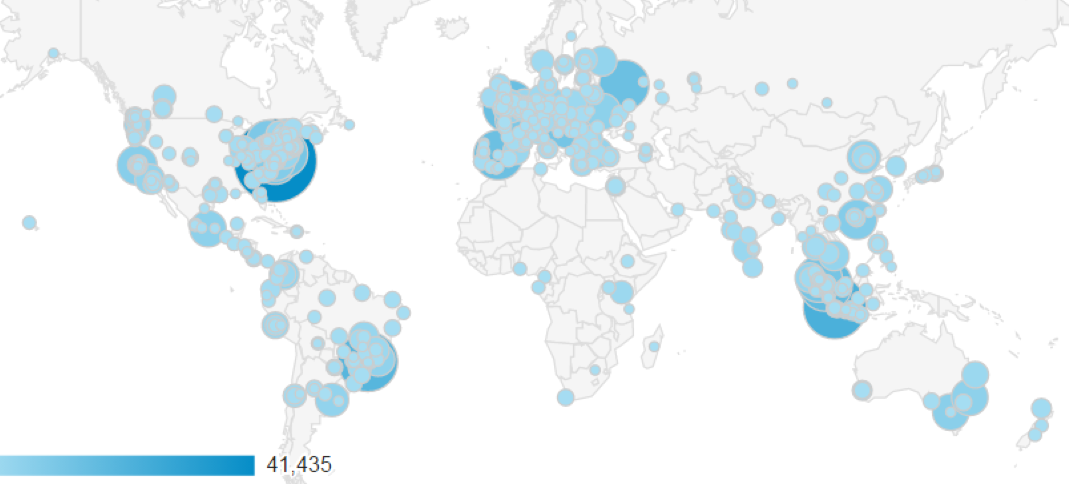
Figure 1 Users of the website by city (source: analytics of GlobalForestWatch.org)
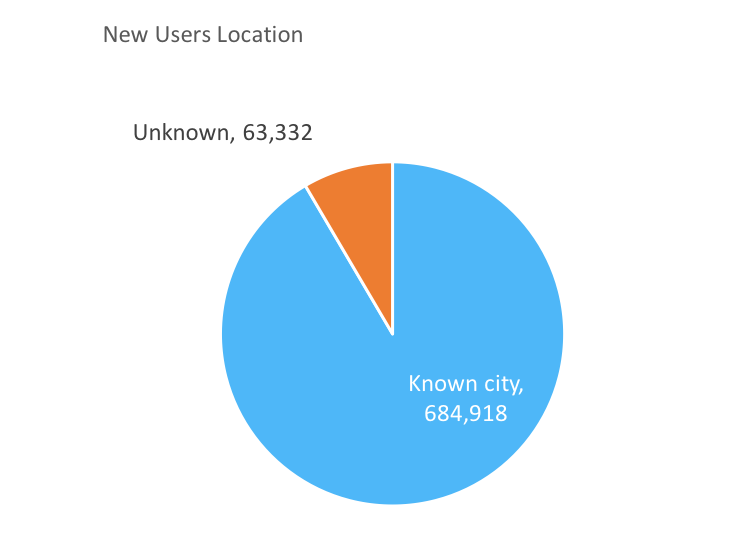
Retrievable data is limited by the technology which tracks users by ip address, so it may be inaccurate. Many visitors can’t be tracked at all. For example, though the above map is informative, the graph shows nearly 10% of the data is missing. While we may know where a user is from and which layers they selected we can’t say how they applied the data. The limited information prevents our team from identifying potential impacts of our platform.
2. Drop-ins
Users can contact GFW directly through a button on the site, or via email. These direct contacts have brought some outcomes to our attention. For example, an Indonesian NGO emailed us about using GFW to support forest protection in vulnerable areas. Stories like these provide positive anecdotes for GFW, but because users reach out ad hoc, we’ll never know how many such stories exist or be able to sift through them to evaluate key measures of success. We also don’t hear about the failures, and follow-up with users can be time-consuming and costly, as many users don’t provide complete information.
3. Networks
Finally, we find user stories through networks — either stories that staff hear at meetings and conferences, or through partners already involved with us, such as donors or grantees — for example, the Jane Goodall Institute is partnering with GFW to include the platform in Ugandan forest rangers’ planning systems. But these stories represent a limited number of our users, particularly those we are already supporting — we still don’t know the factors for success for groups outside our network.
Identifying user stories to demonstrate impact represents a gap in existing methodologies for evaluating open-data platforms, but at GFW, we working hard to find a solution.
The American Evaluation Association is celebrating Data Visualization and Reporting (DVR) Week with our colleagues in the DVR Topical Interest Group. The contributions all this week to aea365 come from DVR TIG members. Do you have questions, concerns, kudos, or content to extend this aea365 contribution? Please add them in the comments section for this post on the aea365 webpage so that we may enrich our community of practice. Would you like to submit an aea365 Tip? Please send a note of interest to aea365@eval.org. aea365 is sponsored by the American Evaluation Association and provides a Tip-a-Day by and for evaluators.