
Hey everyone! I’m Echo Rivera, owner of Creative Research Communications and research associate at Center for Policy Research. My passion is helping evaluators bring creativity to the research communication process. Today I want to talk about your presentation design workflow.
Let me ask you something: does the process of making a presentation stress you out? Do you find you’re always scrambling last minute to finish a presentation on time?
Yeah, I’ve been there. When we have to make several presentations throughout the year, they can add up to a lot of wasted time when done inefficiently.
One part of your workflow might be the biggest problem: Adding visuals.
Does your workflow look something like this?
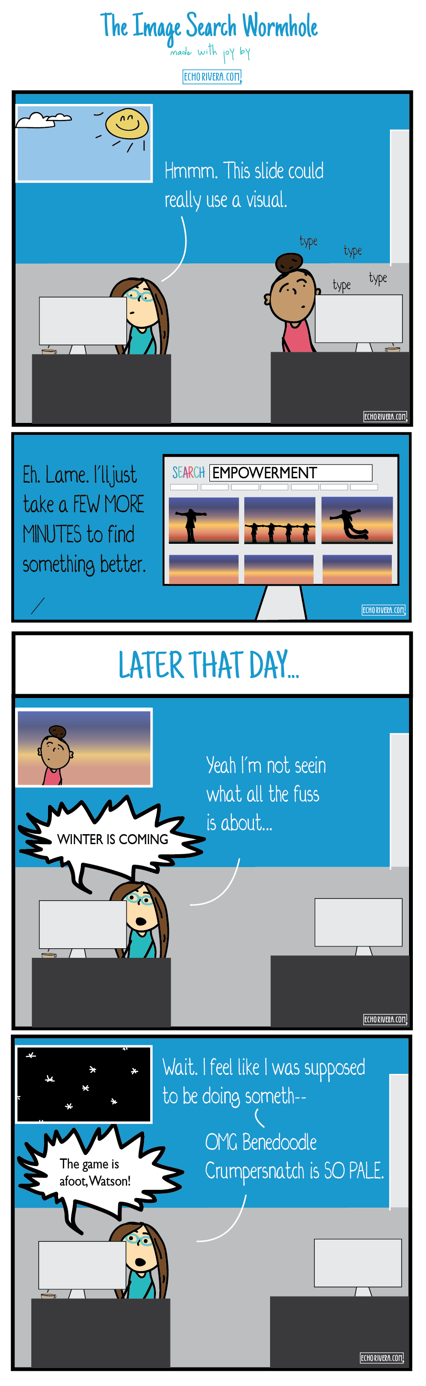
- You’re working on your presentation,
- You look at your slide and think “is there an image for that?”,
- You search and search and search online until you find the right one,
- Then you add it to your presentation, aaaand
- Repeat
Am I close? Or did I miss the step where you get lost in the rabbit hole of news articles, blogs or YouTube?
This simple act of looking for one image at a time is extremely inefficient. When you’re in SPSS crunching numbers, do you suddenly stop and start searching for articles for your lit review, then come back later to finish and print your output?
That would be super inefficient, right? The same idea applies to presentations.
Hot Tip:
You will be most efficient if you approach each presentation activity as a separate, standalone task.
SUGGESTED STEPS TO AN EFFICIENT PRESENTATION DESIGN WORKFLOW:
[1] Set Presentation Goals & Figure Out Your Story
- Think through who the audience is and what will resonate with them the most.
- Decide on 1-3 key point(s) to make in the presentation.
- Brainstorm a “storyboard” that funnels into the key point(s)
[2] Draft Your Presenter Notes
- Following your storyboard, draft what you want to say on the slides
- Do a quick run-through, speaking aloud all of the notes, making adjustments to the order/organization, filling in any gaps, and removing “fluff.”
- Do another run-through to assess time. Add/remove content as necessary. Try to finalize content as much as possible.
[3] Design the Slides
- Copy & paste text from your slides into the presenter notes, adding back in only a few words onto the slide, and no more than 3 points per slide.
- Add high quality visuals on as many slides as possible, reducing excess text as you go along.
- Use design elements to make the remaining text effective (e.g., minimum font size 30).
- If necessary, add simple animations (e.g., appear) to walk the audience through the content.
- Conduct a self-check on the overall presentation to ensure all content is readable & visually appealing.
Rad Resource: Step 3b should not take very long. The trick is to have a Visual Database ready to go. I created a free 6-day email course that shows you how to create one. Check it out!
Do you have questions, concerns, kudos, or content to extend this aea365 contribution? Please add them in the comments section for this post on the aea365 webpage so that we may enrich our community of practice. Would you like to submit an aea365 Tip? Please send a note of interest to aea365@eval.org . aea365 is sponsored by the American Evaluation Association and provides a Tip-a-Day by and for evaluators.
Thank you! Very timely. I’m working on a presentation right now. I’m at the ‘remove fluff and run through it’ stage.
Thanks!
Hi Chari,
Excellent! I’m glad to hear this was a timely post. And I’m quite familiar with that stage of the presentation design process — best of luck for a stellar presentation! – Echo
Hey Cheryl, thanks for leaving a comment 🙂 I’m so glad you found this useful and it’s something that you’ll be able to apply. Best of luck with your infographic! -Echo
Thank you for the great post. I will actually be able to use the info in this post for an info graphic I would like to put out.