
My name is Catherine Callow-Heusser, and I’m the President of EndVision Research and Evaluation. I sometimes provide pro bono statistical services to a local school district that is one of Utah’s highest performing districts in elementary reading and math. They build student success despite having one of the lowest expenditures per pupil in the country.
Hot tip: Underfunded districts appreciate expert help from credible evaluators! They rarely have staffing resources to run statistics beyond descriptives on the multitudes of assessment data they collect. Get involved!
Hot tip: Combining multiple data files, potentially with different structures, is not trivial. For example, Dynamic Indicators of Basic Early Literacy Skills (DIBELS) data files typically have a row for each testing period (i.e., beginning, middle and end of year) for each student, resulting in multiple rows per student, while state test data files may have one row per student.
Rad resources: SPSS allows me to quickly restructure data so each student is represented on only one row and to merge data files based on selected variables (i.e., student_ID). I’ll show you how at my AEA demonstration!
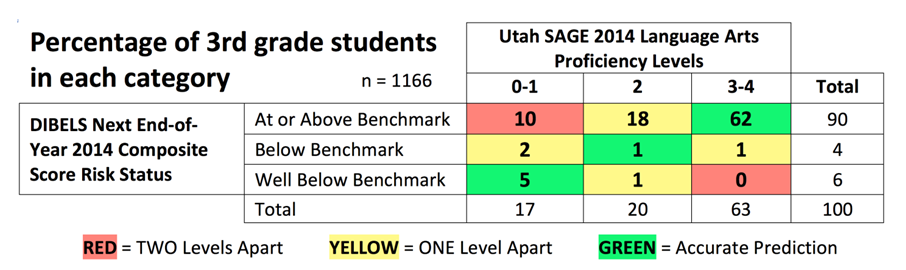
Rad resources: Crosstabs show at a glance the percentages of students in categories, particularly when color coding is added to tables to help make data more visible. The crosstabs table below is color coded to show cells where categories are most unmatched (red) or that reflect accurate predictions (green).
The crosstabs analysis showed that students in the lower left cells of the table (included below) did poorly on both the DIBELS Next assessment and on Utah’s Student Assessment of Growth and Excellence (SAGE) state assessment, while students in the upper left cells did well on the DIBELS but poorly on the SAGE assessment.
Lessons Learned: The visual display paired with matched data files helped district literacy specialists identify students not making adequate progress and plan successive intervention to help them become more proficient in reading. Literacy specialists also used this evidence to push for higher reading goals for “bubble students,” or those near cutoffs, and to share concerns about cutoffs with test developers.
Rad resources: These simple statistical techniques influenced district goals and interventions. Yet, too few districts have staff resources to do this. Be that resource! Train district staff or volunteer to help with data analysis! As evaluators who value providing evidence to improve programs, we can donate useful services that may change policies and help more program recipients succeed.
Rad Resource: Come to my session at Eval 2015.
This contribution is from the aea365 Tip-a-Day Alerts, by and for evaluators, from the American Evaluation Association. Please consider contributing – send a note of interest to aea365@eval.org. Want to learn more from Catherine? She’ll be presenting as part of the Evaluation 2015 Conference Program, November 9-14 in Chicago, Illinois.