
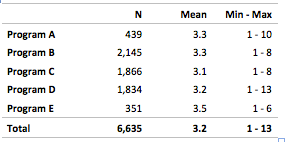
My name is Angie Ficek and I am a Program Evaluator at Professional Data Analysts, Inc. (PDA), a small firm in Minneapolis, MN that specializes in public health evaluation. It wasn’t too long ago that I was reviewing a co-worker’s report and came across a bunch of tables of descriptive statistics like the one below. I couldn’t help but think, “There has got to be a better way to visualize these!”
Then I remembered learning about dot plots from Ann Emery (for a quick 5 minute tutorial on how to create them, click here) and reading a blog post from Stephanie Evergreen on dumbbell plots. I applied the same concepts and came up with this:
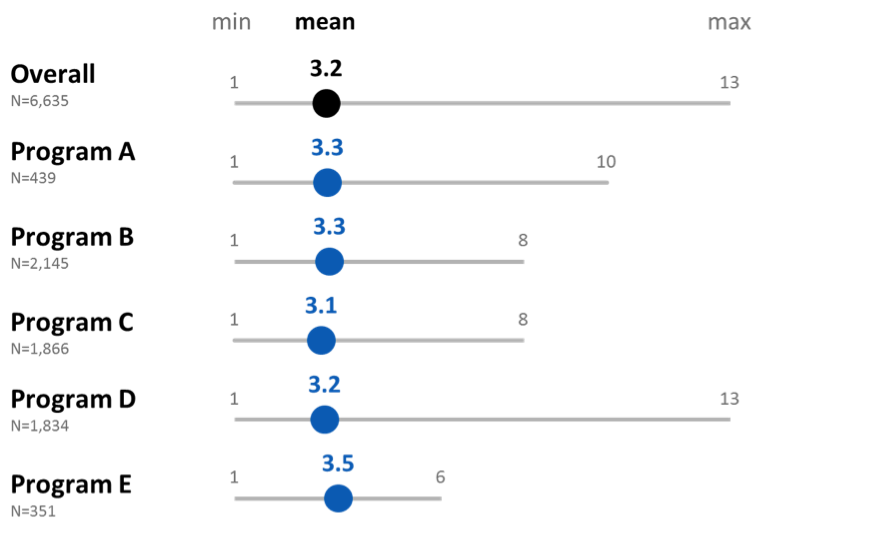
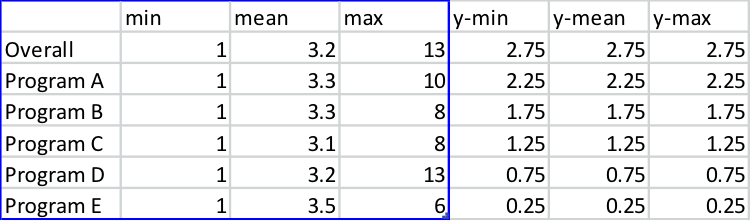
It’s similar to a box or stock plot, but is actually created with an Excel scatterplot. In this example, I had three x-values (for the min, mean, and max), so I inserted three y-values which tell Excel where the data points should fall on the invisible y-axis.
As for the oh-so-important formatting of the data points, I added a marker for the mean and a light gray line to signify the range. I added the automated data labels above each data point and formatted the font size and color so that the means stood out more than the min and max since they were the most important value. Then I manually added text boxes to label the min, mean, and max along the top, and the program names along the left side.
I was really excited to find a simple, visual way for our client to see the pattern of these descriptive statistics a little more quickly. I cannot wait until I get to chart some descriptive statistics again! Said no one ever – until now.
Do you have questions, concerns, kudos, or content to extend this aea365 contribution? Please add them in the comments section for this post on the aea365 webpage so that we may enrich our community of practice. Would you like to submit an aea365 Tip? Please send a note of interest to aea365@eval.org . aea365 is sponsored by the American Evaluation Association and provides a Tip-a-Day by and for evaluators.
Great post Angie. The darker, saturated colors really help to draw viewers’ attention to the mean.
I call these “modified box-and-whisker plots” or “simplified box-and-whisker plots” because they give the viewer the key details from a box-and-whisker (min, max, and mean) without overwhelming them with Q1 and Q3, too.
Thank you again, Ann! I have really enjoyed exploring the various ways to use dot plot type charts.
Many videos on this topic are in http://www.KautilyaClasses.com
Pingback: Angie shares 3 gems from her data viz presentation at MESI | PDA News